Panamanian vs Immigrants from Dominica College, 1 year or more
COMPARE
Panamanian
Immigrants from Dominica
College, 1 year or more
College, 1 year or more Comparison
Panamanians
Immigrants from Dominica
58.3%
COLLEGE, 1 YEAR OR MORE
19.2/ 100
METRIC RATING
204th/ 347
METRIC RANK
52.5%
COLLEGE, 1 YEAR OR MORE
0.0/ 100
METRIC RATING
298th/ 347
METRIC RANK
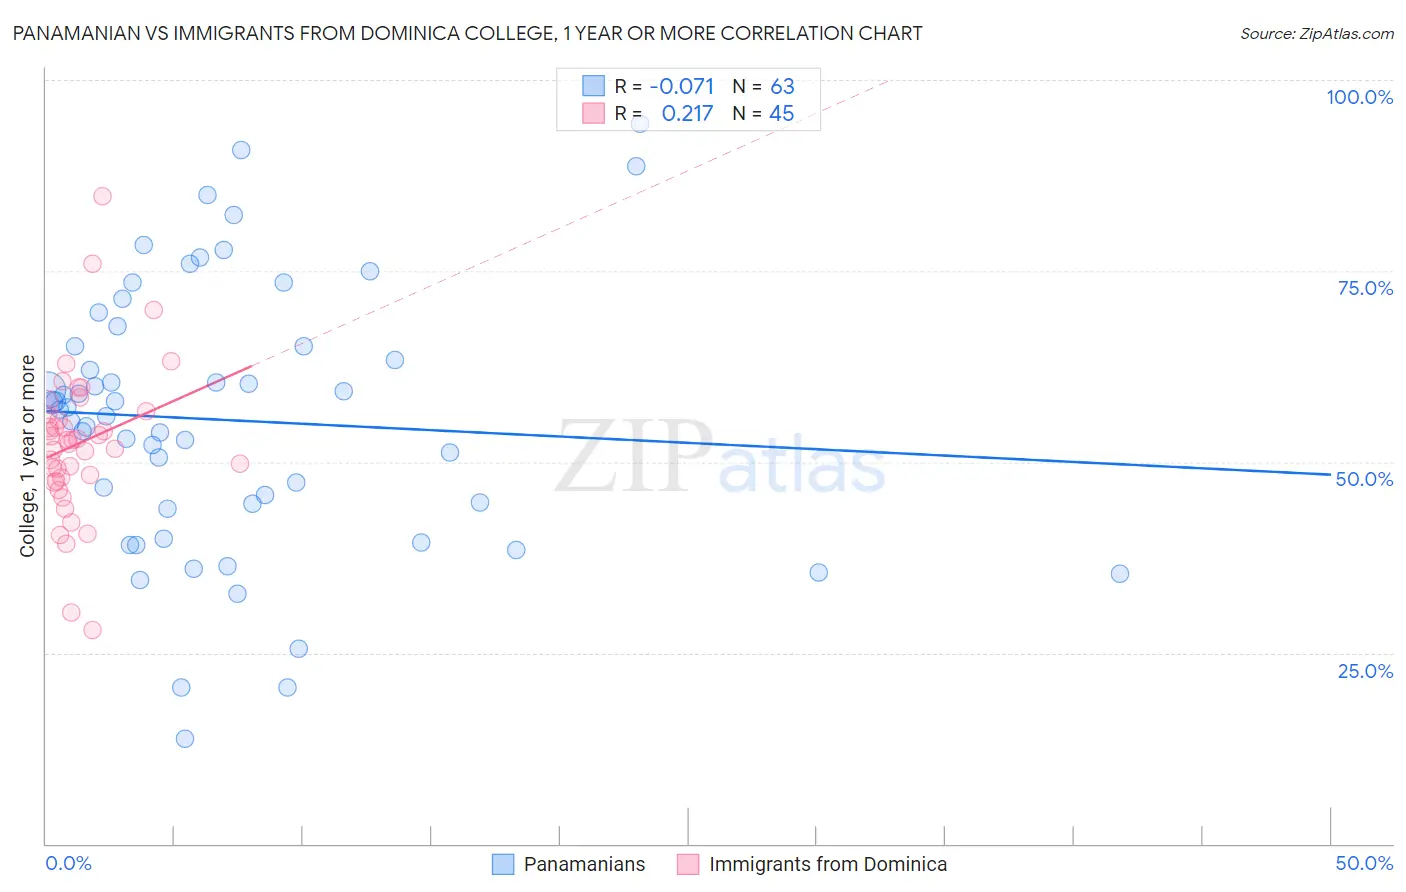
Panamanian vs Immigrants from Dominica College, 1 year or more Correlation Chart
The statistical analysis conducted on geographies consisting of 281,250,786 people shows a slight negative correlation between the proportion of Panamanians and percentage of population with at least college, 1 year or more education in the United States with a correlation coefficient (R) of -0.071 and weighted average of 58.3%. Similarly, the statistical analysis conducted on geographies consisting of 83,795,636 people shows a weak positive correlation between the proportion of Immigrants from Dominica and percentage of population with at least college, 1 year or more education in the United States with a correlation coefficient (R) of 0.217 and weighted average of 52.5%, a difference of 10.9%.
College, 1 year or more Correlation Summary
| Measurement | Panamanian | Immigrants from Dominica |
| Minimum | 13.8% | 28.1% |
| Maximum | 94.2% | 84.8% |
| Range | 80.4% | 56.7% |
| Mean | 55.5% | 52.4% |
| Median | 56.8% | 52.8% |
| Interquartile 25% (IQ1) | 43.9% | 47.7% |
| Interquartile 75% (IQ3) | 65.2% | 56.4% |
| Interquartile Range (IQR) | 21.3% | 8.7% |
| Standard Deviation (Sample) | 17.5% | 10.0% |
| Standard Deviation (Population) | 17.4% | 9.9% |
Similar Demographics by College, 1 year or more
Demographics Similar to Panamanians by College, 1 year or more
In terms of college, 1 year or more, the demographic groups most similar to Panamanians are Immigrants from Zaire (58.3%, a difference of 0.050%), Immigrants from Vietnam (58.2%, a difference of 0.090%), Ghanaian (58.4%, a difference of 0.14%), Senegalese (58.2%, a difference of 0.21%), and Immigrants from South America (58.4%, a difference of 0.23%).
| Demographics | Rating | Rank | College, 1 year or more |
| Immigrants | Thailand | 26.0 /100 | #197 | Fair 58.6% |
| Immigrants | South Eastern Asia | 25.1 /100 | #198 | Fair 58.5% |
| Slovaks | 24.6 /100 | #199 | Fair 58.5% |
| Spanish | 24.2 /100 | #200 | Fair 58.5% |
| Nigerians | 23.0 /100 | #201 | Fair 58.5% |
| Immigrants | South America | 21.9 /100 | #202 | Fair 58.4% |
| Ghanaians | 20.9 /100 | #203 | Fair 58.4% |
| Panamanians | 19.2 /100 | #204 | Poor 58.3% |
| Immigrants | Zaire | 18.7 /100 | #205 | Poor 58.3% |
| Immigrants | Vietnam | 18.2 /100 | #206 | Poor 58.2% |
| Senegalese | 16.9 /100 | #207 | Poor 58.2% |
| Immigrants | Uruguay | 15.2 /100 | #208 | Poor 58.1% |
| Immigrants | Middle Africa | 14.0 /100 | #209 | Poor 58.0% |
| Tsimshian | 13.5 /100 | #210 | Poor 57.9% |
| Immigrants | Nigeria | 13.3 /100 | #211 | Poor 57.9% |
Demographics Similar to Immigrants from Dominica by College, 1 year or more
In terms of college, 1 year or more, the demographic groups most similar to Immigrants from Dominica are Immigrants from Nicaragua (52.4%, a difference of 0.34%), Choctaw (52.3%, a difference of 0.38%), Haitian (52.3%, a difference of 0.44%), Puerto Rican (52.2%, a difference of 0.57%), and Paiute (52.9%, a difference of 0.59%).
| Demographics | Rating | Rank | College, 1 year or more |
| Cubans | 0.0 /100 | #291 | Tragic 53.4% |
| Chickasaw | 0.0 /100 | #292 | Tragic 53.3% |
| Blacks/African Americans | 0.0 /100 | #293 | Tragic 53.3% |
| Cherokee | 0.0 /100 | #294 | Tragic 53.2% |
| Yaqui | 0.0 /100 | #295 | Tragic 53.2% |
| Sioux | 0.0 /100 | #296 | Tragic 53.0% |
| Paiute | 0.0 /100 | #297 | Tragic 52.9% |
| Immigrants | Dominica | 0.0 /100 | #298 | Tragic 52.5% |
| Immigrants | Nicaragua | 0.0 /100 | #299 | Tragic 52.4% |
| Choctaw | 0.0 /100 | #300 | Tragic 52.3% |
| Haitians | 0.0 /100 | #301 | Tragic 52.3% |
| Puerto Ricans | 0.0 /100 | #302 | Tragic 52.2% |
| Creek | 0.0 /100 | #303 | Tragic 52.2% |
| Central Americans | 0.0 /100 | #304 | Tragic 52.1% |
| Seminole | 0.0 /100 | #305 | Tragic 52.1% |