Palestinian vs Immigrants from Germany Per Capita Income
COMPARE
Palestinian
Immigrants from Germany
Per Capita Income
Per Capita Income Comparison
Palestinians
Immigrants from Germany
$45,790
PER CAPITA INCOME
91.6/ 100
METRIC RATING
126th/ 347
METRIC RANK
$45,751
PER CAPITA INCOME
91.3/ 100
METRIC RATING
127th/ 347
METRIC RANK
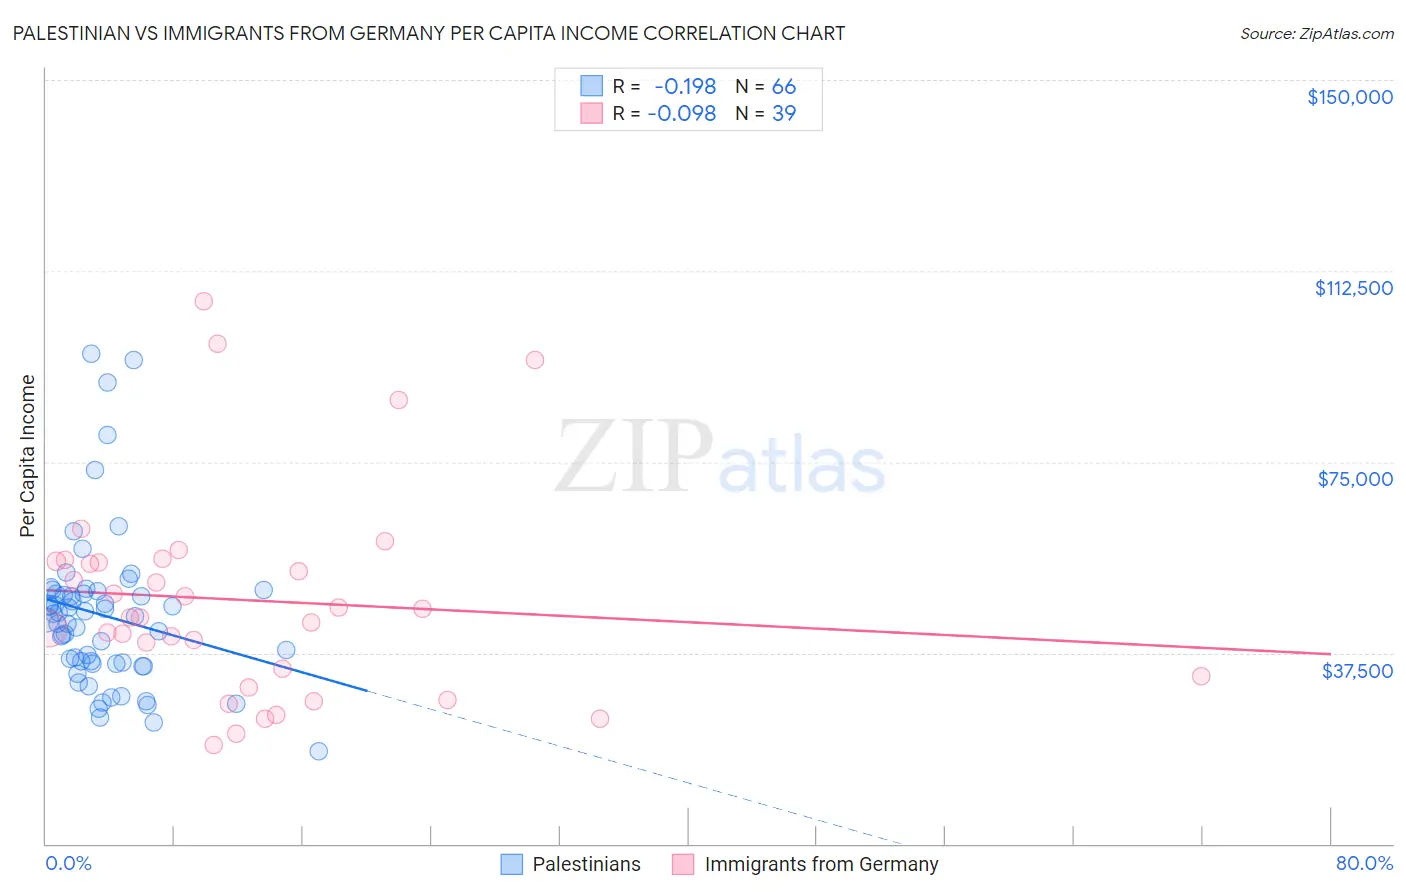
Palestinian vs Immigrants from Germany Per Capita Income Correlation Chart
The statistical analysis conducted on geographies consisting of 216,465,639 people shows a poor negative correlation between the proportion of Palestinians and per capita income in the United States with a correlation coefficient (R) of -0.198 and weighted average of $45,790. Similarly, the statistical analysis conducted on geographies consisting of 463,898,714 people shows a slight negative correlation between the proportion of Immigrants from Germany and per capita income in the United States with a correlation coefficient (R) of -0.098 and weighted average of $45,751, a difference of 0.090%.
Per Capita Income Correlation Summary
| Measurement | Palestinian | Immigrants from Germany |
| Minimum | $18,117 | $19,389 |
| Maximum | $96,141 | $106,492 |
| Range | $78,024 | $87,103 |
| Mean | $44,786 | $47,817 |
| Median | $44,344 | $44,537 |
| Interquartile 25% (IQ1) | $35,413 | $32,967 |
| Interquartile 75% (IQ3) | $49,208 | $55,483 |
| Interquartile Range (IQR) | $13,795 | $22,516 |
| Standard Deviation (Sample) | $15,475 | $20,412 |
| Standard Deviation (Population) | $15,357 | $20,149 |
Demographics Similar to Palestinians and Immigrants from Germany by Per Capita Income
In terms of per capita income, the demographic groups most similar to Palestinians are Zimbabwean ($45,804, a difference of 0.030%), Swedish ($45,750, a difference of 0.090%), European ($45,836, a difference of 0.10%), Lebanese ($45,840, a difference of 0.11%), and Moroccan ($45,854, a difference of 0.14%). Similarly, the demographic groups most similar to Immigrants from Germany are Swedish ($45,750, a difference of 0.0%), Zimbabwean ($45,804, a difference of 0.12%), European ($45,836, a difference of 0.19%), Luxembourger ($45,663, a difference of 0.19%), and Lebanese ($45,840, a difference of 0.20%).
| Demographics | Rating | Rank | Per Capita Income |
| Poles | 94.1 /100 | #116 | Exceptional $46,123 |
| Chinese | 93.9 /100 | #117 | Exceptional $46,098 |
| Immigrants | Saudi Arabia | 93.3 /100 | #118 | Exceptional $46,008 |
| Immigrants | Poland | 93.1 /100 | #119 | Exceptional $45,979 |
| Immigrants | Ethiopia | 92.7 /100 | #120 | Exceptional $45,923 |
| Canadians | 92.2 /100 | #121 | Exceptional $45,858 |
| Moroccans | 92.1 /100 | #122 | Exceptional $45,854 |
| Lebanese | 92.0 /100 | #123 | Exceptional $45,840 |
| Europeans | 92.0 /100 | #124 | Exceptional $45,836 |
| Zimbabweans | 91.7 /100 | #125 | Exceptional $45,804 |
| Palestinians | 91.6 /100 | #126 | Exceptional $45,790 |
| Immigrants | Germany | 91.3 /100 | #127 | Exceptional $45,751 |
| Swedes | 91.3 /100 | #128 | Exceptional $45,750 |
| Luxembourgers | 90.4 /100 | #129 | Exceptional $45,663 |
| Arabs | 90.4 /100 | #130 | Exceptional $45,662 |
| Immigrants | North Macedonia | 90.0 /100 | #131 | Exceptional $45,622 |
| Jordanians | 89.9 /100 | #132 | Excellent $45,605 |
| Pakistanis | 89.7 /100 | #133 | Excellent $45,587 |
| Slovenes | 89.6 /100 | #134 | Excellent $45,581 |
| Hungarians | 87.9 /100 | #135 | Excellent $45,426 |
| Immigrants | Oceania | 85.2 /100 | #136 | Excellent $45,220 |