Immigrants from Bangladesh vs Immigrants from Portugal Per Capita Income
COMPARE
Immigrants from Bangladesh
Immigrants from Portugal
Per Capita Income
Per Capita Income Comparison
Immigrants from Bangladesh
Immigrants from Portugal
$41,709
PER CAPITA INCOME
10.1/ 100
METRIC RATING
214th/ 347
METRIC RANK
$42,412
PER CAPITA INCOME
19.7/ 100
METRIC RATING
198th/ 347
METRIC RANK
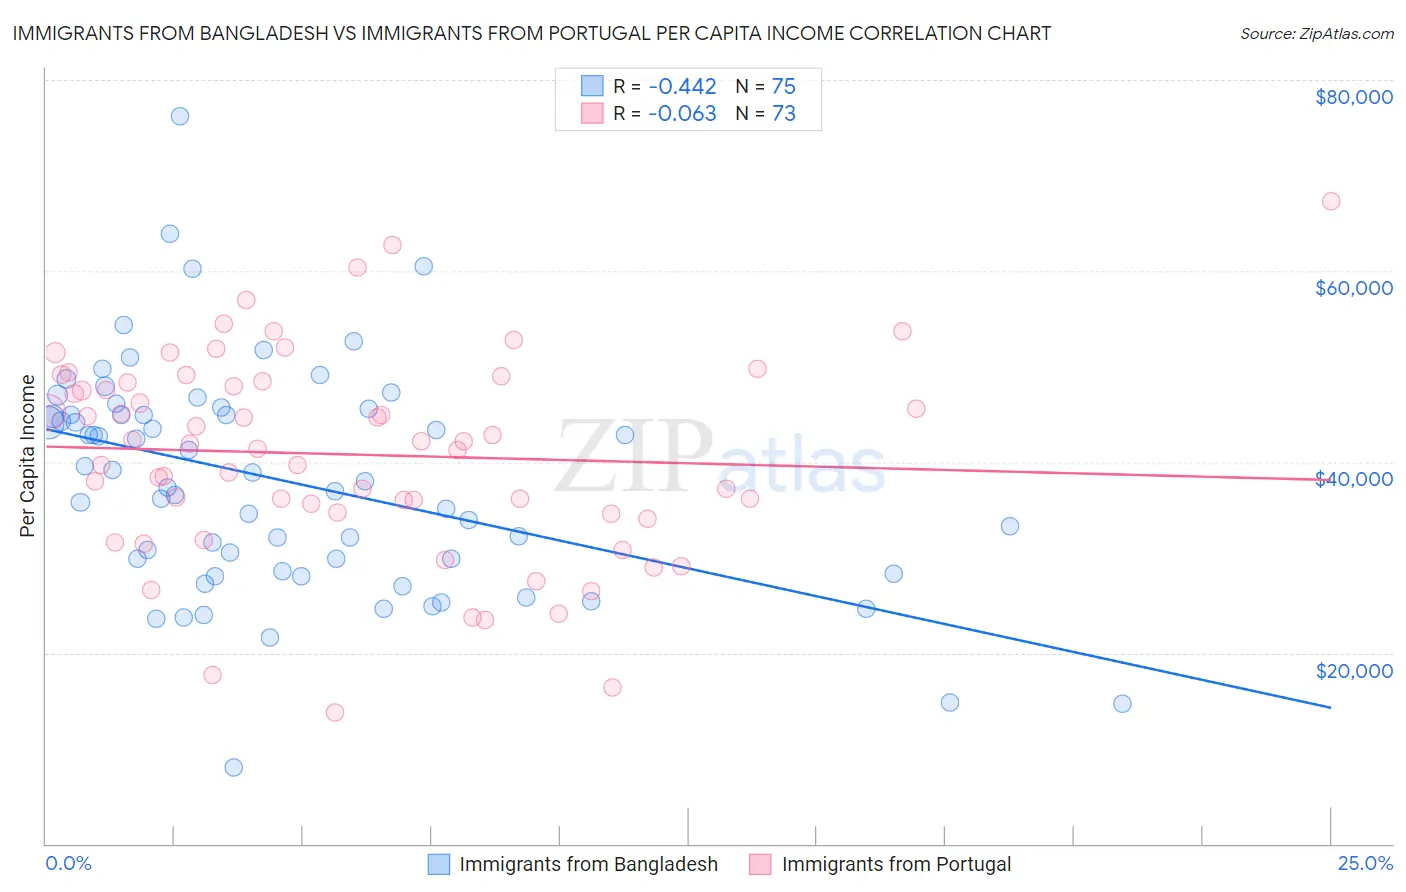
Immigrants from Bangladesh vs Immigrants from Portugal Per Capita Income Correlation Chart
The statistical analysis conducted on geographies consisting of 203,679,462 people shows a moderate negative correlation between the proportion of Immigrants from Bangladesh and per capita income in the United States with a correlation coefficient (R) of -0.442 and weighted average of $41,709. Similarly, the statistical analysis conducted on geographies consisting of 174,792,548 people shows a slight negative correlation between the proportion of Immigrants from Portugal and per capita income in the United States with a correlation coefficient (R) of -0.063 and weighted average of $42,412, a difference of 1.7%.
Per Capita Income Correlation Summary
| Measurement | Immigrants from Bangladesh | Immigrants from Portugal |
| Minimum | $8,026 | $13,756 |
| Maximum | $76,210 | $67,338 |
| Range | $68,184 | $53,582 |
| Mean | $37,925 | $40,766 |
| Median | $37,941 | $41,948 |
| Interquartile 25% (IQ1) | $28,589 | $34,644 |
| Interquartile 75% (IQ3) | $44,956 | $48,401 |
| Interquartile Range (IQR) | $16,367 | $13,757 |
| Standard Deviation (Sample) | $11,865 | $10,670 |
| Standard Deviation (Population) | $11,786 | $10,597 |
Demographics Similar to Immigrants from Bangladesh and Immigrants from Portugal by Per Capita Income
In terms of per capita income, the demographic groups most similar to Immigrants from Bangladesh are Sudanese ($41,695, a difference of 0.030%), Immigrants from Venezuela ($41,727, a difference of 0.040%), Tongan ($41,693, a difference of 0.040%), Immigrants from Senegal ($41,830, a difference of 0.29%), and Immigrants from Panama ($41,853, a difference of 0.34%). Similarly, the demographic groups most similar to Immigrants from Portugal are Barbadian ($42,406, a difference of 0.010%), Vietnamese ($42,368, a difference of 0.10%), Immigrants from Thailand ($42,289, a difference of 0.29%), Immigrants from Bosnia and Herzegovina ($42,278, a difference of 0.32%), and Scotch-Irish ($42,563, a difference of 0.36%).
| Demographics | Rating | Rank | Per Capita Income |
| Dutch | 23.4 /100 | #196 | Fair $42,605 |
| Scotch-Irish | 22.6 /100 | #197 | Fair $42,563 |
| Immigrants | Portugal | 19.7 /100 | #198 | Poor $42,412 |
| Barbadians | 19.6 /100 | #199 | Poor $42,406 |
| Vietnamese | 19.0 /100 | #200 | Poor $42,368 |
| Immigrants | Thailand | 17.6 /100 | #201 | Poor $42,289 |
| Immigrants | Bosnia and Herzegovina | 17.5 /100 | #202 | Poor $42,278 |
| Spanish | 17.0 /100 | #203 | Poor $42,249 |
| Aleuts | 16.4 /100 | #204 | Poor $42,210 |
| Whites/Caucasians | 15.9 /100 | #205 | Poor $42,180 |
| Ghanaians | 15.7 /100 | #206 | Poor $42,164 |
| Venezuelans | 14.4 /100 | #207 | Poor $42,074 |
| Panamanians | 13.9 /100 | #208 | Poor $42,035 |
| Immigrants | Sudan | 13.2 /100 | #209 | Poor $41,986 |
| Ecuadorians | 12.9 /100 | #210 | Poor $41,958 |
| Immigrants | Panama | 11.6 /100 | #211 | Poor $41,853 |
| Immigrants | Senegal | 11.3 /100 | #212 | Poor $41,830 |
| Immigrants | Venezuela | 10.2 /100 | #213 | Poor $41,727 |
| Immigrants | Bangladesh | 10.1 /100 | #214 | Poor $41,709 |
| Sudanese | 9.9 /100 | #215 | Tragic $41,695 |
| Tongans | 9.9 /100 | #216 | Tragic $41,693 |