Palestinian vs Paiute Per Capita Income
COMPARE
Palestinian
Paiute
Per Capita Income
Per Capita Income Comparison
Palestinians
Paiute
$45,790
PER CAPITA INCOME
91.6/ 100
METRIC RATING
126th/ 347
METRIC RANK
$37,066
PER CAPITA INCOME
0.1/ 100
METRIC RATING
303rd/ 347
METRIC RANK
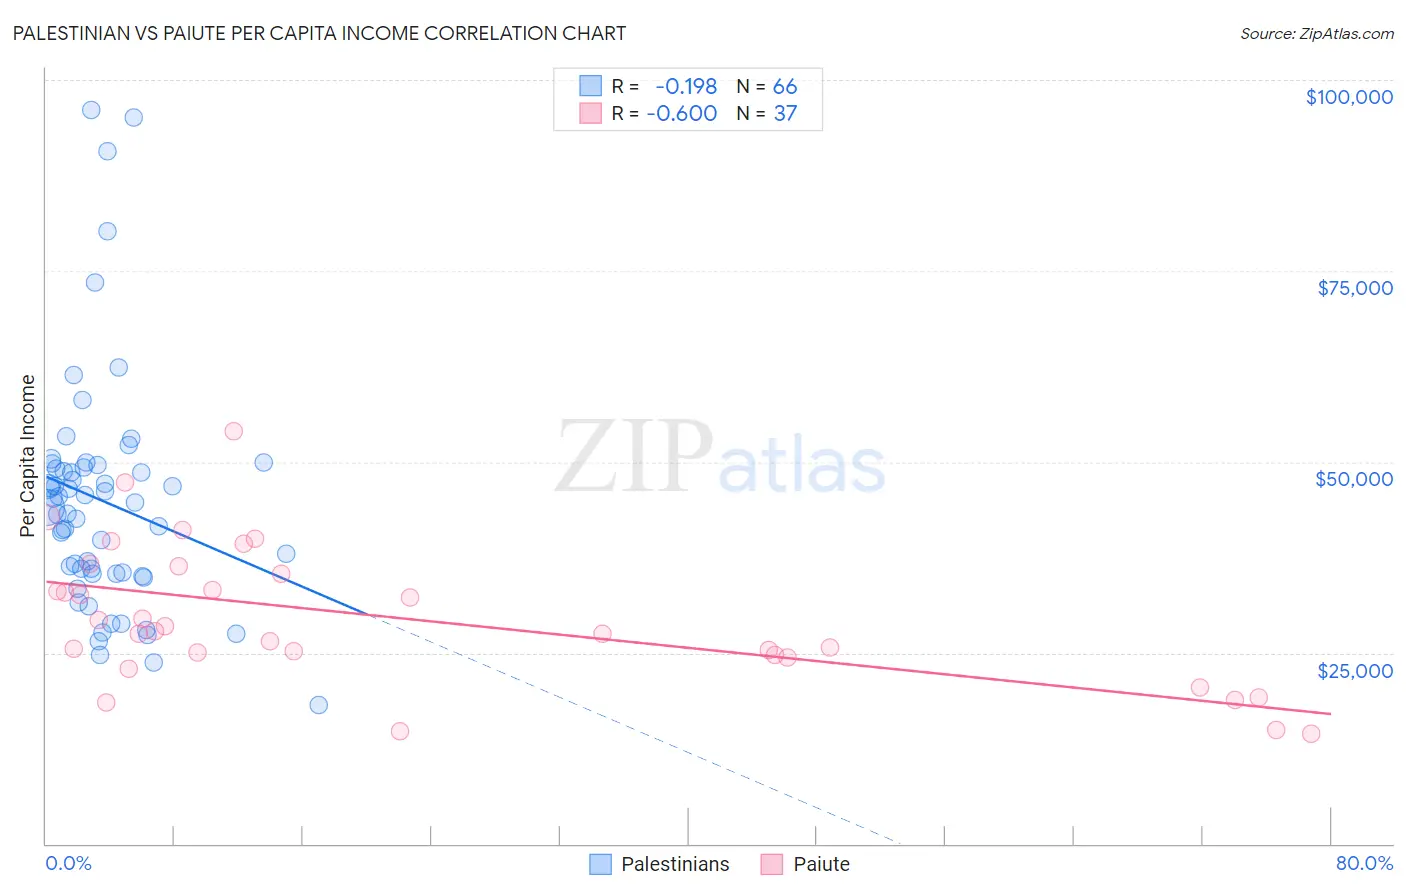
Palestinian vs Paiute Per Capita Income Correlation Chart
The statistical analysis conducted on geographies consisting of 216,465,639 people shows a poor negative correlation between the proportion of Palestinians and per capita income in the United States with a correlation coefficient (R) of -0.198 and weighted average of $45,790. Similarly, the statistical analysis conducted on geographies consisting of 58,406,657 people shows a substantial negative correlation between the proportion of Paiute and per capita income in the United States with a correlation coefficient (R) of -0.600 and weighted average of $37,066, a difference of 23.5%.
Per Capita Income Correlation Summary
| Measurement | Palestinian | Paiute |
| Minimum | $18,117 | $14,446 |
| Maximum | $96,141 | $53,939 |
| Range | $78,024 | $39,493 |
| Mean | $44,786 | $29,535 |
| Median | $44,344 | $27,776 |
| Interquartile 25% (IQ1) | $35,413 | $24,580 |
| Interquartile 75% (IQ3) | $49,208 | $35,820 |
| Interquartile Range (IQR) | $13,795 | $11,240 |
| Standard Deviation (Sample) | $15,475 | $9,120 |
| Standard Deviation (Population) | $15,357 | $8,996 |
Similar Demographics by Per Capita Income
Demographics Similar to Palestinians by Per Capita Income
In terms of per capita income, the demographic groups most similar to Palestinians are Zimbabwean ($45,804, a difference of 0.030%), Immigrants from Germany ($45,751, a difference of 0.090%), Swedish ($45,750, a difference of 0.090%), European ($45,836, a difference of 0.10%), and Lebanese ($45,840, a difference of 0.11%).
| Demographics | Rating | Rank | Per Capita Income |
| Immigrants | Poland | 93.1 /100 | #119 | Exceptional $45,979 |
| Immigrants | Ethiopia | 92.7 /100 | #120 | Exceptional $45,923 |
| Canadians | 92.2 /100 | #121 | Exceptional $45,858 |
| Moroccans | 92.1 /100 | #122 | Exceptional $45,854 |
| Lebanese | 92.0 /100 | #123 | Exceptional $45,840 |
| Europeans | 92.0 /100 | #124 | Exceptional $45,836 |
| Zimbabweans | 91.7 /100 | #125 | Exceptional $45,804 |
| Palestinians | 91.6 /100 | #126 | Exceptional $45,790 |
| Immigrants | Germany | 91.3 /100 | #127 | Exceptional $45,751 |
| Swedes | 91.3 /100 | #128 | Exceptional $45,750 |
| Luxembourgers | 90.4 /100 | #129 | Exceptional $45,663 |
| Arabs | 90.4 /100 | #130 | Exceptional $45,662 |
| Immigrants | North Macedonia | 90.0 /100 | #131 | Exceptional $45,622 |
| Jordanians | 89.9 /100 | #132 | Excellent $45,605 |
| Pakistanis | 89.7 /100 | #133 | Excellent $45,587 |
Demographics Similar to Paiute by Per Capita Income
In terms of per capita income, the demographic groups most similar to Paiute are Shoshone ($37,072, a difference of 0.020%), Honduran ($37,031, a difference of 0.090%), Ottawa ($37,101, a difference of 0.10%), Inupiat ($36,999, a difference of 0.18%), and Immigrants from Bahamas ($37,193, a difference of 0.34%).
| Demographics | Rating | Rank | Per Capita Income |
| Indonesians | 0.1 /100 | #296 | Tragic $37,300 |
| Haitians | 0.1 /100 | #297 | Tragic $37,289 |
| Immigrants | Caribbean | 0.1 /100 | #298 | Tragic $37,254 |
| Cherokee | 0.1 /100 | #299 | Tragic $37,203 |
| Immigrants | Bahamas | 0.1 /100 | #300 | Tragic $37,193 |
| Ottawa | 0.1 /100 | #301 | Tragic $37,101 |
| Shoshone | 0.1 /100 | #302 | Tragic $37,072 |
| Paiute | 0.1 /100 | #303 | Tragic $37,066 |
| Hondurans | 0.1 /100 | #304 | Tragic $37,031 |
| Inupiat | 0.1 /100 | #305 | Tragic $36,999 |
| Immigrants | Haiti | 0.0 /100 | #306 | Tragic $36,849 |
| Immigrants | Latin America | 0.0 /100 | #307 | Tragic $36,823 |
| Fijians | 0.0 /100 | #308 | Tragic $36,690 |
| Immigrants | Honduras | 0.0 /100 | #309 | Tragic $36,665 |
| Ute | 0.0 /100 | #310 | Tragic $36,651 |