Palestinian vs Ghanaian Per Capita Income
COMPARE
Palestinian
Ghanaian
Per Capita Income
Per Capita Income Comparison
Palestinians
Ghanaians
$45,790
PER CAPITA INCOME
91.6/ 100
METRIC RATING
126th/ 347
METRIC RANK
$42,164
PER CAPITA INCOME
15.7/ 100
METRIC RATING
206th/ 347
METRIC RANK
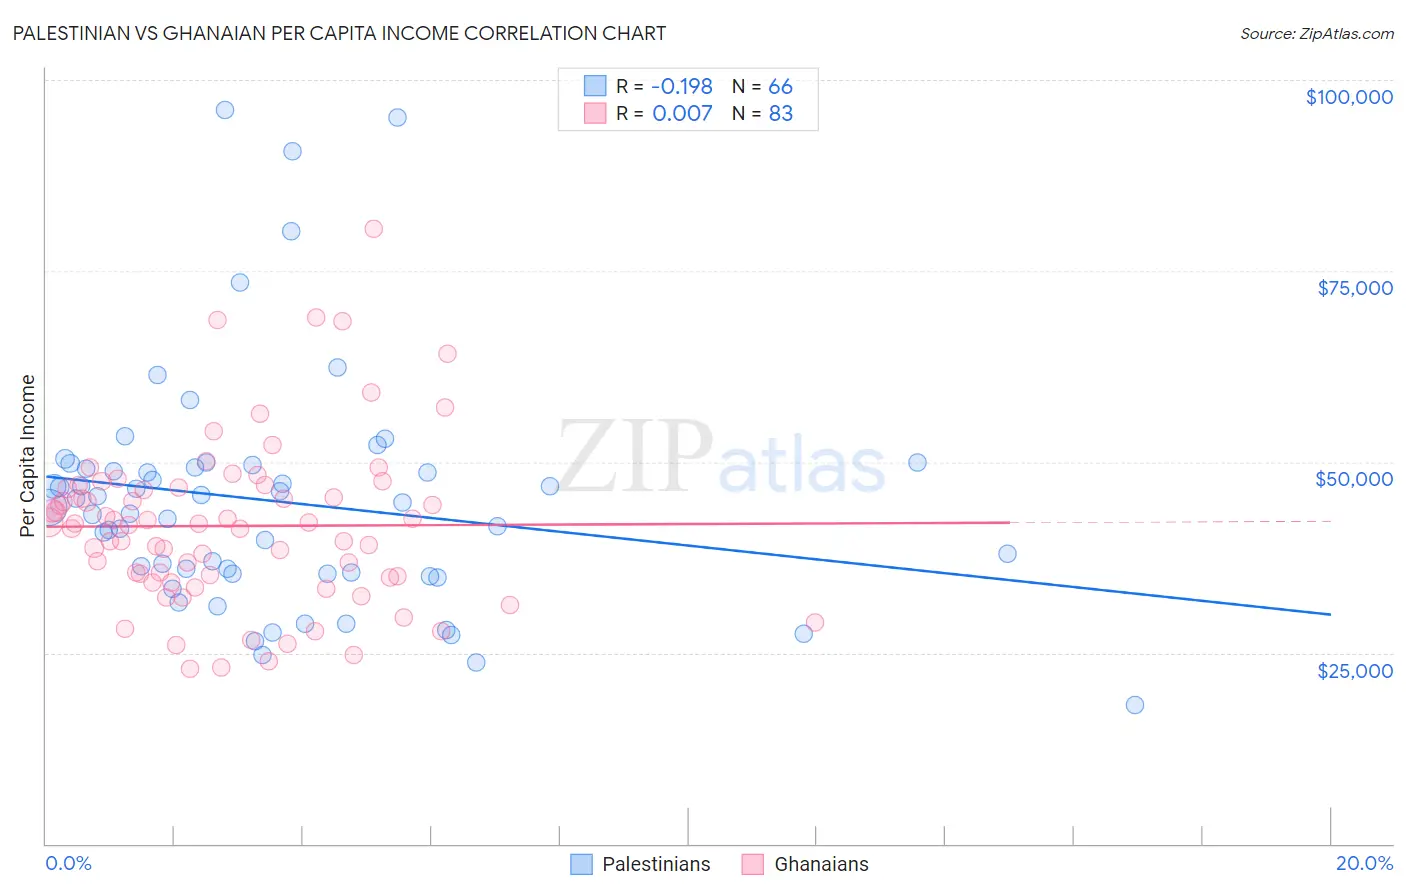
Palestinian vs Ghanaian Per Capita Income Correlation Chart
The statistical analysis conducted on geographies consisting of 216,465,639 people shows a poor negative correlation between the proportion of Palestinians and per capita income in the United States with a correlation coefficient (R) of -0.198 and weighted average of $45,790. Similarly, the statistical analysis conducted on geographies consisting of 190,723,780 people shows no correlation between the proportion of Ghanaians and per capita income in the United States with a correlation coefficient (R) of 0.007 and weighted average of $42,164, a difference of 8.6%.
Per Capita Income Correlation Summary
| Measurement | Palestinian | Ghanaian |
| Minimum | $18,117 | $22,951 |
| Maximum | $96,141 | $80,537 |
| Range | $78,024 | $57,586 |
| Mean | $44,786 | $41,613 |
| Median | $44,344 | $41,877 |
| Interquartile 25% (IQ1) | $35,413 | $34,906 |
| Interquartile 75% (IQ3) | $49,208 | $46,657 |
| Interquartile Range (IQR) | $13,795 | $11,751 |
| Standard Deviation (Sample) | $15,475 | $10,874 |
| Standard Deviation (Population) | $15,357 | $10,809 |
Similar Demographics by Per Capita Income
Demographics Similar to Palestinians by Per Capita Income
In terms of per capita income, the demographic groups most similar to Palestinians are Zimbabwean ($45,804, a difference of 0.030%), Immigrants from Germany ($45,751, a difference of 0.090%), Swedish ($45,750, a difference of 0.090%), European ($45,836, a difference of 0.10%), and Lebanese ($45,840, a difference of 0.11%).
| Demographics | Rating | Rank | Per Capita Income |
| Immigrants | Poland | 93.1 /100 | #119 | Exceptional $45,979 |
| Immigrants | Ethiopia | 92.7 /100 | #120 | Exceptional $45,923 |
| Canadians | 92.2 /100 | #121 | Exceptional $45,858 |
| Moroccans | 92.1 /100 | #122 | Exceptional $45,854 |
| Lebanese | 92.0 /100 | #123 | Exceptional $45,840 |
| Europeans | 92.0 /100 | #124 | Exceptional $45,836 |
| Zimbabweans | 91.7 /100 | #125 | Exceptional $45,804 |
| Palestinians | 91.6 /100 | #126 | Exceptional $45,790 |
| Immigrants | Germany | 91.3 /100 | #127 | Exceptional $45,751 |
| Swedes | 91.3 /100 | #128 | Exceptional $45,750 |
| Luxembourgers | 90.4 /100 | #129 | Exceptional $45,663 |
| Arabs | 90.4 /100 | #130 | Exceptional $45,662 |
| Immigrants | North Macedonia | 90.0 /100 | #131 | Exceptional $45,622 |
| Jordanians | 89.9 /100 | #132 | Excellent $45,605 |
| Pakistanis | 89.7 /100 | #133 | Excellent $45,587 |
Demographics Similar to Ghanaians by Per Capita Income
In terms of per capita income, the demographic groups most similar to Ghanaians are White/Caucasian ($42,180, a difference of 0.040%), Aleut ($42,210, a difference of 0.11%), Spanish ($42,249, a difference of 0.20%), Venezuelan ($42,074, a difference of 0.21%), and Immigrants from Bosnia and Herzegovina ($42,278, a difference of 0.27%).
| Demographics | Rating | Rank | Per Capita Income |
| Barbadians | 19.6 /100 | #199 | Poor $42,406 |
| Vietnamese | 19.0 /100 | #200 | Poor $42,368 |
| Immigrants | Thailand | 17.6 /100 | #201 | Poor $42,289 |
| Immigrants | Bosnia and Herzegovina | 17.5 /100 | #202 | Poor $42,278 |
| Spanish | 17.0 /100 | #203 | Poor $42,249 |
| Aleuts | 16.4 /100 | #204 | Poor $42,210 |
| Whites/Caucasians | 15.9 /100 | #205 | Poor $42,180 |
| Ghanaians | 15.7 /100 | #206 | Poor $42,164 |
| Venezuelans | 14.4 /100 | #207 | Poor $42,074 |
| Panamanians | 13.9 /100 | #208 | Poor $42,035 |
| Immigrants | Sudan | 13.2 /100 | #209 | Poor $41,986 |
| Ecuadorians | 12.9 /100 | #210 | Poor $41,958 |
| Immigrants | Panama | 11.6 /100 | #211 | Poor $41,853 |
| Immigrants | Senegal | 11.3 /100 | #212 | Poor $41,830 |
| Immigrants | Venezuela | 10.2 /100 | #213 | Poor $41,727 |