Marshallese vs Immigrants from Portugal Per Capita Income
COMPARE
Marshallese
Immigrants from Portugal
Per Capita Income
Per Capita Income Comparison
Marshallese
Immigrants from Portugal
$39,108
PER CAPITA INCOME
0.6/ 100
METRIC RATING
261st/ 347
METRIC RANK
$42,412
PER CAPITA INCOME
19.7/ 100
METRIC RATING
198th/ 347
METRIC RANK
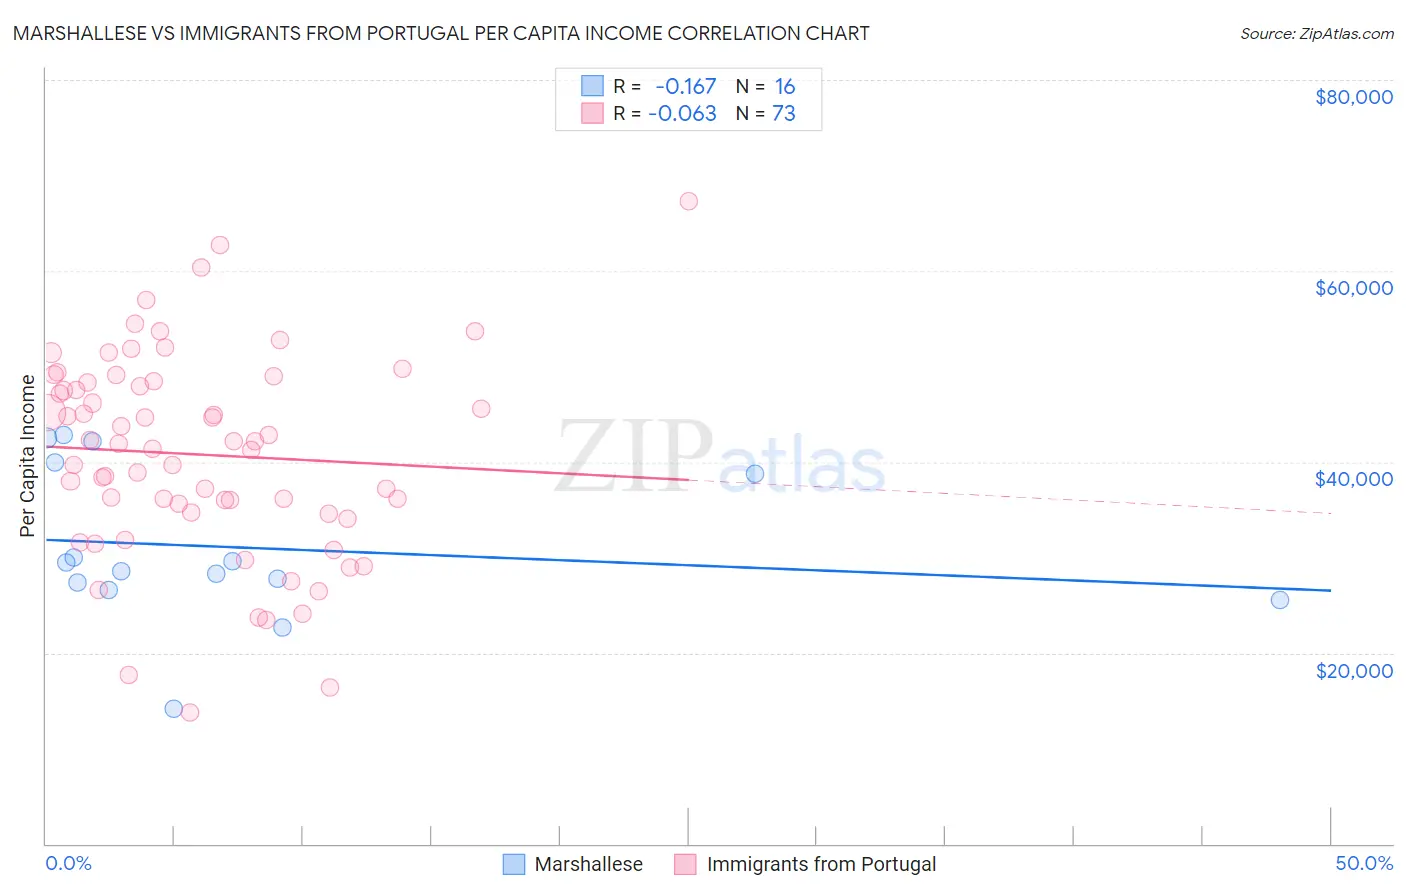
Marshallese vs Immigrants from Portugal Per Capita Income Correlation Chart
The statistical analysis conducted on geographies consisting of 14,761,315 people shows a poor negative correlation between the proportion of Marshallese and per capita income in the United States with a correlation coefficient (R) of -0.167 and weighted average of $39,108. Similarly, the statistical analysis conducted on geographies consisting of 174,792,548 people shows a slight negative correlation between the proportion of Immigrants from Portugal and per capita income in the United States with a correlation coefficient (R) of -0.063 and weighted average of $42,412, a difference of 8.5%.
Per Capita Income Correlation Summary
| Measurement | Marshallese | Immigrants from Portugal |
| Minimum | $14,082 | $13,756 |
| Maximum | $42,763 | $67,338 |
| Range | $28,681 | $53,582 |
| Mean | $31,016 | $40,766 |
| Median | $29,047 | $41,948 |
| Interquartile 25% (IQ1) | $26,970 | $34,644 |
| Interquartile 75% (IQ3) | $39,382 | $48,401 |
| Interquartile Range (IQR) | $12,413 | $13,757 |
| Standard Deviation (Sample) | $8,089 | $10,670 |
| Standard Deviation (Population) | $7,833 | $10,597 |
Similar Demographics by Per Capita Income
Demographics Similar to Marshallese by Per Capita Income
In terms of per capita income, the demographic groups most similar to Marshallese are Iroquois ($39,104, a difference of 0.010%), Belizean ($39,097, a difference of 0.030%), Alaskan Athabascan ($39,163, a difference of 0.14%), American ($39,039, a difference of 0.17%), and Malaysian ($39,194, a difference of 0.22%).
| Demographics | Rating | Rank | Per Capita Income |
| Alaska Natives | 1.0 /100 | #254 | Tragic $39,558 |
| Immigrants | Middle Africa | 1.0 /100 | #255 | Tragic $39,529 |
| Hawaiians | 0.8 /100 | #256 | Tragic $39,403 |
| Nicaraguans | 0.8 /100 | #257 | Tragic $39,372 |
| Jamaicans | 0.7 /100 | #258 | Tragic $39,231 |
| Malaysians | 0.7 /100 | #259 | Tragic $39,194 |
| Alaskan Athabascans | 0.6 /100 | #260 | Tragic $39,163 |
| Marshallese | 0.6 /100 | #261 | Tragic $39,108 |
| Iroquois | 0.6 /100 | #262 | Tragic $39,104 |
| Belizeans | 0.6 /100 | #263 | Tragic $39,097 |
| Americans | 0.6 /100 | #264 | Tragic $39,039 |
| Spanish Americans | 0.5 /100 | #265 | Tragic $39,012 |
| Salvadorans | 0.5 /100 | #266 | Tragic $38,858 |
| Immigrants | Zaire | 0.4 /100 | #267 | Tragic $38,848 |
| Liberians | 0.4 /100 | #268 | Tragic $38,780 |
Demographics Similar to Immigrants from Portugal by Per Capita Income
In terms of per capita income, the demographic groups most similar to Immigrants from Portugal are Barbadian ($42,406, a difference of 0.010%), Vietnamese ($42,368, a difference of 0.10%), Immigrants from Thailand ($42,289, a difference of 0.29%), Immigrants from Bosnia and Herzegovina ($42,278, a difference of 0.32%), and Scotch-Irish ($42,563, a difference of 0.36%).
| Demographics | Rating | Rank | Per Capita Income |
| Yugoslavians | 27.4 /100 | #191 | Fair $42,792 |
| Iraqis | 26.7 /100 | #192 | Fair $42,760 |
| Immigrants | Sierra Leone | 26.5 /100 | #193 | Fair $42,752 |
| Immigrants | Fiji | 25.2 /100 | #194 | Fair $42,694 |
| Immigrants | Kenya | 24.5 /100 | #195 | Fair $42,661 |
| Dutch | 23.4 /100 | #196 | Fair $42,605 |
| Scotch-Irish | 22.6 /100 | #197 | Fair $42,563 |
| Immigrants | Portugal | 19.7 /100 | #198 | Poor $42,412 |
| Barbadians | 19.6 /100 | #199 | Poor $42,406 |
| Vietnamese | 19.0 /100 | #200 | Poor $42,368 |
| Immigrants | Thailand | 17.6 /100 | #201 | Poor $42,289 |
| Immigrants | Bosnia and Herzegovina | 17.5 /100 | #202 | Poor $42,278 |
| Spanish | 17.0 /100 | #203 | Poor $42,249 |
| Aleuts | 16.4 /100 | #204 | Poor $42,210 |
| Whites/Caucasians | 15.9 /100 | #205 | Poor $42,180 |