Palestinian vs Peruvian Per Capita Income
COMPARE
Palestinian
Peruvian
Per Capita Income
Per Capita Income Comparison
Palestinians
Peruvians
$45,790
PER CAPITA INCOME
91.6/ 100
METRIC RATING
126th/ 347
METRIC RANK
$44,479
PER CAPITA INCOME
71.5/ 100
METRIC RATING
152nd/ 347
METRIC RANK
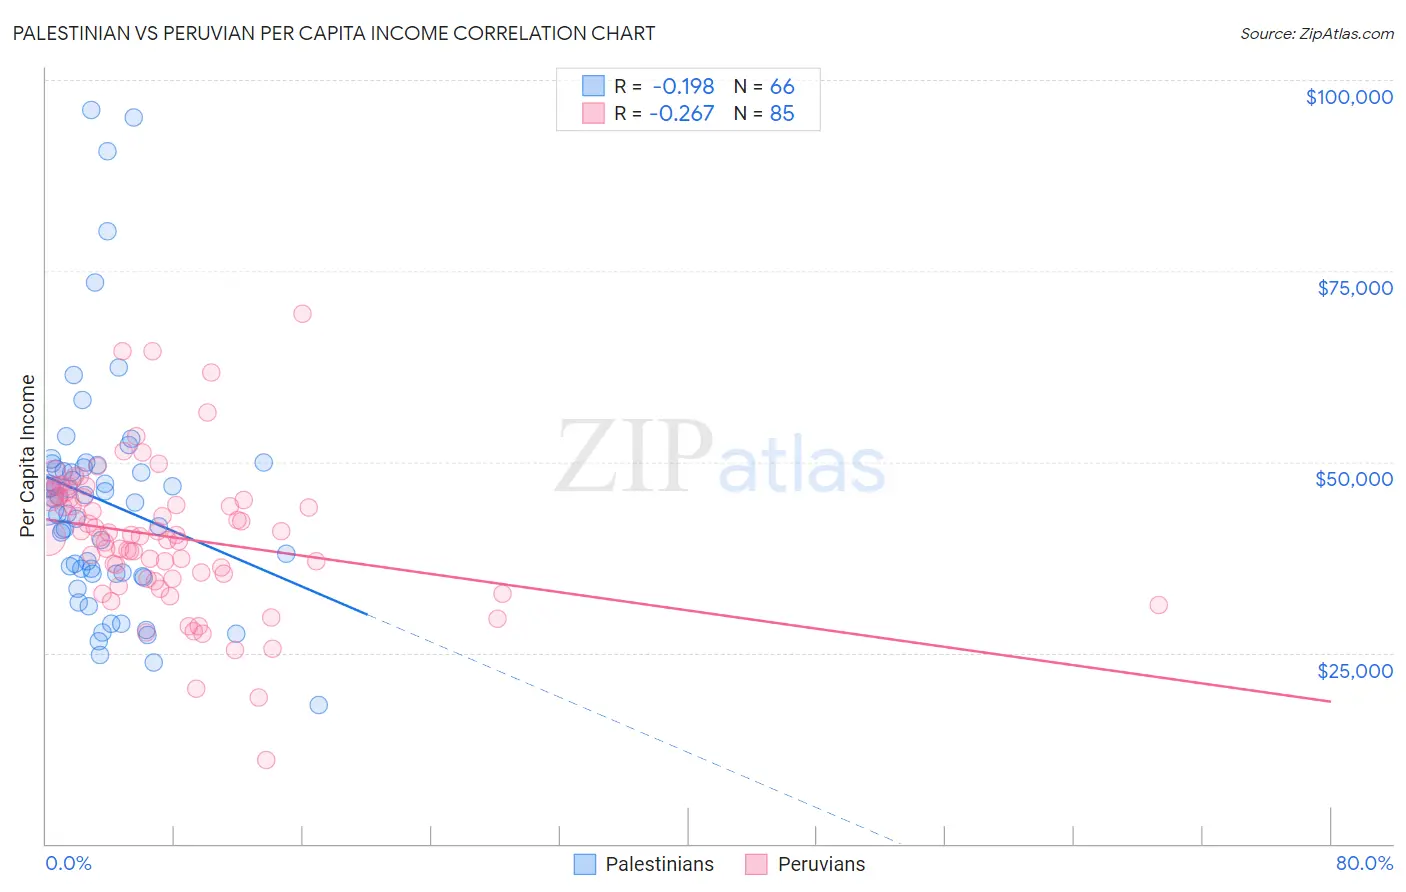
Palestinian vs Peruvian Per Capita Income Correlation Chart
The statistical analysis conducted on geographies consisting of 216,465,639 people shows a poor negative correlation between the proportion of Palestinians and per capita income in the United States with a correlation coefficient (R) of -0.198 and weighted average of $45,790. Similarly, the statistical analysis conducted on geographies consisting of 363,263,285 people shows a weak negative correlation between the proportion of Peruvians and per capita income in the United States with a correlation coefficient (R) of -0.267 and weighted average of $44,479, a difference of 2.9%.
Per Capita Income Correlation Summary
| Measurement | Palestinian | Peruvian |
| Minimum | $18,117 | $11,041 |
| Maximum | $96,141 | $69,376 |
| Range | $78,024 | $58,335 |
| Mean | $44,786 | $40,176 |
| Median | $44,344 | $40,253 |
| Interquartile 25% (IQ1) | $35,413 | $34,775 |
| Interquartile 75% (IQ3) | $49,208 | $45,381 |
| Interquartile Range (IQR) | $13,795 | $10,606 |
| Standard Deviation (Sample) | $15,475 | $9,639 |
| Standard Deviation (Population) | $15,357 | $9,582 |
Similar Demographics by Per Capita Income
Demographics Similar to Palestinians by Per Capita Income
In terms of per capita income, the demographic groups most similar to Palestinians are Zimbabwean ($45,804, a difference of 0.030%), Immigrants from Germany ($45,751, a difference of 0.090%), Swedish ($45,750, a difference of 0.090%), European ($45,836, a difference of 0.10%), and Lebanese ($45,840, a difference of 0.11%).
| Demographics | Rating | Rank | Per Capita Income |
| Immigrants | Poland | 93.1 /100 | #119 | Exceptional $45,979 |
| Immigrants | Ethiopia | 92.7 /100 | #120 | Exceptional $45,923 |
| Canadians | 92.2 /100 | #121 | Exceptional $45,858 |
| Moroccans | 92.1 /100 | #122 | Exceptional $45,854 |
| Lebanese | 92.0 /100 | #123 | Exceptional $45,840 |
| Europeans | 92.0 /100 | #124 | Exceptional $45,836 |
| Zimbabweans | 91.7 /100 | #125 | Exceptional $45,804 |
| Palestinians | 91.6 /100 | #126 | Exceptional $45,790 |
| Immigrants | Germany | 91.3 /100 | #127 | Exceptional $45,751 |
| Swedes | 91.3 /100 | #128 | Exceptional $45,750 |
| Luxembourgers | 90.4 /100 | #129 | Exceptional $45,663 |
| Arabs | 90.4 /100 | #130 | Exceptional $45,662 |
| Immigrants | North Macedonia | 90.0 /100 | #131 | Exceptional $45,622 |
| Jordanians | 89.9 /100 | #132 | Excellent $45,605 |
| Pakistanis | 89.7 /100 | #133 | Excellent $45,587 |
Demographics Similar to Peruvians by Per Capita Income
In terms of per capita income, the demographic groups most similar to Peruvians are Norwegian ($44,480, a difference of 0.0%), Immigrants from Eritrea ($44,509, a difference of 0.070%), Scottish ($44,440, a difference of 0.090%), Korean ($44,522, a difference of 0.10%), and Immigrants from Armenia ($44,552, a difference of 0.17%).
| Demographics | Rating | Rank | Per Capita Income |
| Immigrants | Afghanistan | 78.0 /100 | #145 | Good $44,790 |
| Irish | 75.8 /100 | #146 | Good $44,679 |
| Czechs | 74.1 /100 | #147 | Good $44,595 |
| Immigrants | Armenia | 73.1 /100 | #148 | Good $44,552 |
| Koreans | 72.5 /100 | #149 | Good $44,522 |
| Immigrants | Eritrea | 72.1 /100 | #150 | Good $44,509 |
| Norwegians | 71.5 /100 | #151 | Good $44,480 |
| Peruvians | 71.5 /100 | #152 | Good $44,479 |
| Scottish | 70.6 /100 | #153 | Good $44,440 |
| Portuguese | 68.7 /100 | #154 | Good $44,362 |
| Uruguayans | 67.6 /100 | #155 | Good $44,318 |
| Slovaks | 65.4 /100 | #156 | Good $44,229 |
| South American Indians | 64.8 /100 | #157 | Good $44,206 |
| Immigrants | Nepal | 64.3 /100 | #158 | Good $44,187 |
| South Americans | 62.4 /100 | #159 | Good $44,114 |