Palestinian vs Hispanic or Latino Per Capita Income
COMPARE
Palestinian
Hispanic or Latino
Per Capita Income
Per Capita Income Comparison
Palestinians
Hispanics or Latinos
$45,790
PER CAPITA INCOME
91.6/ 100
METRIC RATING
126th/ 347
METRIC RANK
$35,688
PER CAPITA INCOME
0.0/ 100
METRIC RATING
320th/ 347
METRIC RANK
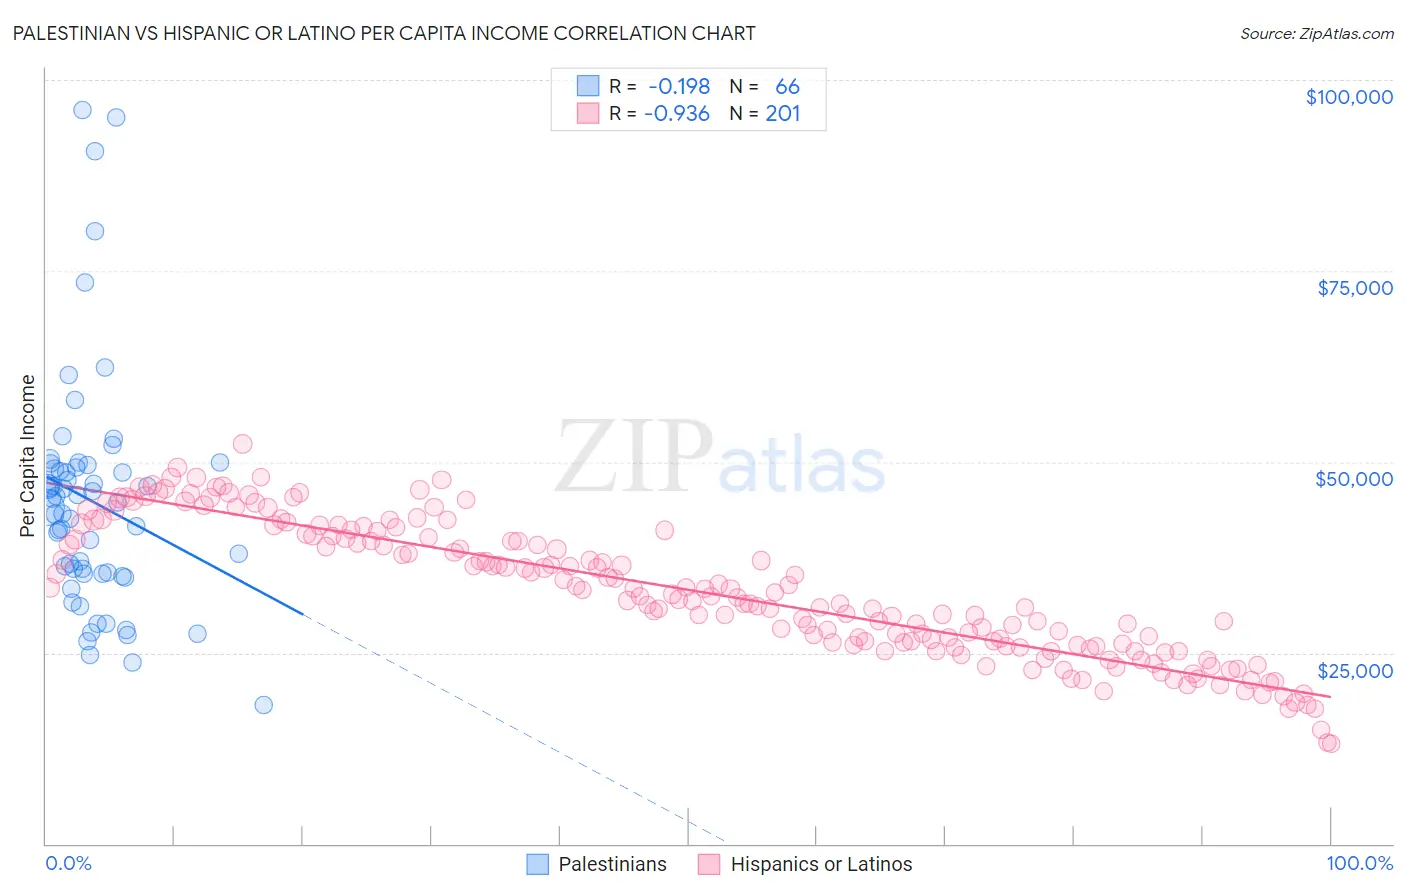
Palestinian vs Hispanic or Latino Per Capita Income Correlation Chart
The statistical analysis conducted on geographies consisting of 216,465,639 people shows a poor negative correlation between the proportion of Palestinians and per capita income in the United States with a correlation coefficient (R) of -0.198 and weighted average of $45,790. Similarly, the statistical analysis conducted on geographies consisting of 578,671,475 people shows a near-perfect negative correlation between the proportion of Hispanics or Latinos and per capita income in the United States with a correlation coefficient (R) of -0.936 and weighted average of $35,688, a difference of 28.3%.
Per Capita Income Correlation Summary
| Measurement | Palestinian | Hispanic or Latino |
| Minimum | $18,117 | $13,071 |
| Maximum | $96,141 | $52,297 |
| Range | $78,024 | $39,226 |
| Mean | $44,786 | $33,168 |
| Median | $44,344 | $32,664 |
| Interquartile 25% (IQ1) | $35,413 | $26,111 |
| Interquartile 75% (IQ3) | $49,208 | $40,424 |
| Interquartile Range (IQR) | $13,795 | $14,314 |
| Standard Deviation (Sample) | $15,475 | $8,715 |
| Standard Deviation (Population) | $15,357 | $8,693 |
Similar Demographics by Per Capita Income
Demographics Similar to Palestinians by Per Capita Income
In terms of per capita income, the demographic groups most similar to Palestinians are Zimbabwean ($45,804, a difference of 0.030%), Immigrants from Germany ($45,751, a difference of 0.090%), Swedish ($45,750, a difference of 0.090%), European ($45,836, a difference of 0.10%), and Lebanese ($45,840, a difference of 0.11%).
| Demographics | Rating | Rank | Per Capita Income |
| Immigrants | Poland | 93.1 /100 | #119 | Exceptional $45,979 |
| Immigrants | Ethiopia | 92.7 /100 | #120 | Exceptional $45,923 |
| Canadians | 92.2 /100 | #121 | Exceptional $45,858 |
| Moroccans | 92.1 /100 | #122 | Exceptional $45,854 |
| Lebanese | 92.0 /100 | #123 | Exceptional $45,840 |
| Europeans | 92.0 /100 | #124 | Exceptional $45,836 |
| Zimbabweans | 91.7 /100 | #125 | Exceptional $45,804 |
| Palestinians | 91.6 /100 | #126 | Exceptional $45,790 |
| Immigrants | Germany | 91.3 /100 | #127 | Exceptional $45,751 |
| Swedes | 91.3 /100 | #128 | Exceptional $45,750 |
| Luxembourgers | 90.4 /100 | #129 | Exceptional $45,663 |
| Arabs | 90.4 /100 | #130 | Exceptional $45,662 |
| Immigrants | North Macedonia | 90.0 /100 | #131 | Exceptional $45,622 |
| Jordanians | 89.9 /100 | #132 | Excellent $45,605 |
| Pakistanis | 89.7 /100 | #133 | Excellent $45,587 |
Demographics Similar to Hispanics or Latinos by Per Capita Income
In terms of per capita income, the demographic groups most similar to Hispanics or Latinos are Immigrants from Congo ($35,720, a difference of 0.090%), Black/African American ($35,564, a difference of 0.35%), Creek ($35,546, a difference of 0.40%), Bangladeshi ($35,897, a difference of 0.59%), and Dutch West Indian ($35,922, a difference of 0.66%).
| Demographics | Rating | Rank | Per Capita Income |
| Bahamians | 0.0 /100 | #313 | Tragic $36,427 |
| Seminole | 0.0 /100 | #314 | Tragic $36,180 |
| Yaqui | 0.0 /100 | #315 | Tragic $36,112 |
| Choctaw | 0.0 /100 | #316 | Tragic $35,999 |
| Dutch West Indians | 0.0 /100 | #317 | Tragic $35,922 |
| Bangladeshis | 0.0 /100 | #318 | Tragic $35,897 |
| Immigrants | Congo | 0.0 /100 | #319 | Tragic $35,720 |
| Hispanics or Latinos | 0.0 /100 | #320 | Tragic $35,688 |
| Blacks/African Americans | 0.0 /100 | #321 | Tragic $35,564 |
| Creek | 0.0 /100 | #322 | Tragic $35,546 |
| Cheyenne | 0.0 /100 | #323 | Tragic $35,276 |
| Kiowa | 0.0 /100 | #324 | Tragic $35,102 |
| Immigrants | Central America | 0.0 /100 | #325 | Tragic $34,974 |
| Immigrants | Cuba | 0.0 /100 | #326 | Tragic $34,910 |
| Apache | 0.0 /100 | #327 | Tragic $34,886 |