Palestinian vs Immigrants from Colombia Per Capita Income
COMPARE
Palestinian
Immigrants from Colombia
Per Capita Income
Per Capita Income Comparison
Palestinians
Immigrants from Colombia
$45,790
PER CAPITA INCOME
91.6/ 100
METRIC RATING
126th/ 347
METRIC RANK
$42,971
PER CAPITA INCOME
31.5/ 100
METRIC RATING
187th/ 347
METRIC RANK
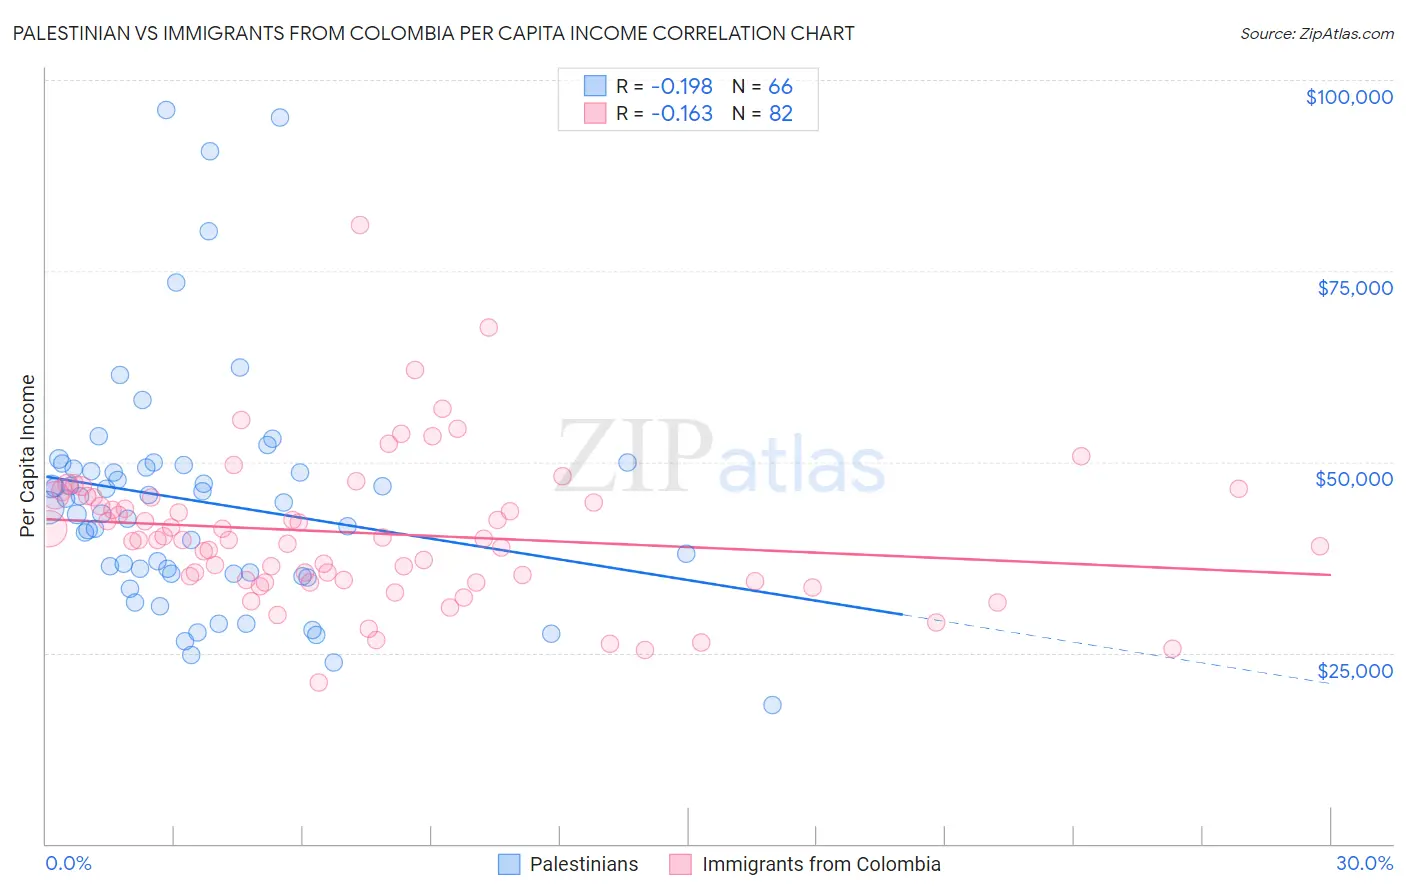
Palestinian vs Immigrants from Colombia Per Capita Income Correlation Chart
The statistical analysis conducted on geographies consisting of 216,465,639 people shows a poor negative correlation between the proportion of Palestinians and per capita income in the United States with a correlation coefficient (R) of -0.198 and weighted average of $45,790. Similarly, the statistical analysis conducted on geographies consisting of 378,698,677 people shows a poor negative correlation between the proportion of Immigrants from Colombia and per capita income in the United States with a correlation coefficient (R) of -0.163 and weighted average of $42,971, a difference of 6.6%.
Per Capita Income Correlation Summary
| Measurement | Palestinian | Immigrants from Colombia |
| Minimum | $18,117 | $21,139 |
| Maximum | $96,141 | $80,934 |
| Range | $78,024 | $59,795 |
| Mean | $44,786 | $40,659 |
| Median | $44,344 | $39,822 |
| Interquartile 25% (IQ1) | $35,413 | $34,523 |
| Interquartile 75% (IQ3) | $49,208 | $45,376 |
| Interquartile Range (IQR) | $13,795 | $10,853 |
| Standard Deviation (Sample) | $15,475 | $9,573 |
| Standard Deviation (Population) | $15,357 | $9,515 |
Similar Demographics by Per Capita Income
Demographics Similar to Palestinians by Per Capita Income
In terms of per capita income, the demographic groups most similar to Palestinians are Zimbabwean ($45,804, a difference of 0.030%), Immigrants from Germany ($45,751, a difference of 0.090%), Swedish ($45,750, a difference of 0.090%), European ($45,836, a difference of 0.10%), and Lebanese ($45,840, a difference of 0.11%).
| Demographics | Rating | Rank | Per Capita Income |
| Immigrants | Poland | 93.1 /100 | #119 | Exceptional $45,979 |
| Immigrants | Ethiopia | 92.7 /100 | #120 | Exceptional $45,923 |
| Canadians | 92.2 /100 | #121 | Exceptional $45,858 |
| Moroccans | 92.1 /100 | #122 | Exceptional $45,854 |
| Lebanese | 92.0 /100 | #123 | Exceptional $45,840 |
| Europeans | 92.0 /100 | #124 | Exceptional $45,836 |
| Zimbabweans | 91.7 /100 | #125 | Exceptional $45,804 |
| Palestinians | 91.6 /100 | #126 | Exceptional $45,790 |
| Immigrants | Germany | 91.3 /100 | #127 | Exceptional $45,751 |
| Swedes | 91.3 /100 | #128 | Exceptional $45,750 |
| Luxembourgers | 90.4 /100 | #129 | Exceptional $45,663 |
| Arabs | 90.4 /100 | #130 | Exceptional $45,662 |
| Immigrants | North Macedonia | 90.0 /100 | #131 | Exceptional $45,622 |
| Jordanians | 89.9 /100 | #132 | Excellent $45,605 |
| Pakistanis | 89.7 /100 | #133 | Excellent $45,587 |
Demographics Similar to Immigrants from Colombia by Per Capita Income
In terms of per capita income, the demographic groups most similar to Immigrants from Colombia are Immigrants from Africa ($42,950, a difference of 0.050%), French Canadian ($43,003, a difference of 0.070%), Immigrants ($43,010, a difference of 0.090%), Spaniard ($43,028, a difference of 0.13%), and Bermudan ($42,911, a difference of 0.14%).
| Demographics | Rating | Rank | Per Capita Income |
| Sierra Leoneans | 42.9 /100 | #180 | Average $43,405 |
| Welsh | 38.2 /100 | #181 | Fair $43,233 |
| Immigrants | Vietnam | 38.1 /100 | #182 | Fair $43,229 |
| Germans | 33.9 /100 | #183 | Fair $43,067 |
| Spaniards | 32.9 /100 | #184 | Fair $43,028 |
| Immigrants | Immigrants | 32.5 /100 | #185 | Fair $43,010 |
| French Canadians | 32.3 /100 | #186 | Fair $43,003 |
| Immigrants | Colombia | 31.5 /100 | #187 | Fair $42,971 |
| Immigrants | Africa | 31.0 /100 | #188 | Fair $42,950 |
| Bermudans | 30.1 /100 | #189 | Fair $42,911 |
| Kenyans | 27.7 /100 | #190 | Fair $42,808 |
| Yugoslavians | 27.4 /100 | #191 | Fair $42,792 |
| Iraqis | 26.7 /100 | #192 | Fair $42,760 |
| Immigrants | Sierra Leone | 26.5 /100 | #193 | Fair $42,752 |
| Immigrants | Fiji | 25.2 /100 | #194 | Fair $42,694 |