Immigrants from Belgium vs Ghanaian Per Capita Income
COMPARE
Immigrants from Belgium
Ghanaian
Per Capita Income
Per Capita Income Comparison
Immigrants from Belgium
Ghanaians
$55,082
PER CAPITA INCOME
100.0/ 100
METRIC RATING
14th/ 347
METRIC RANK
$42,164
PER CAPITA INCOME
15.7/ 100
METRIC RATING
206th/ 347
METRIC RANK
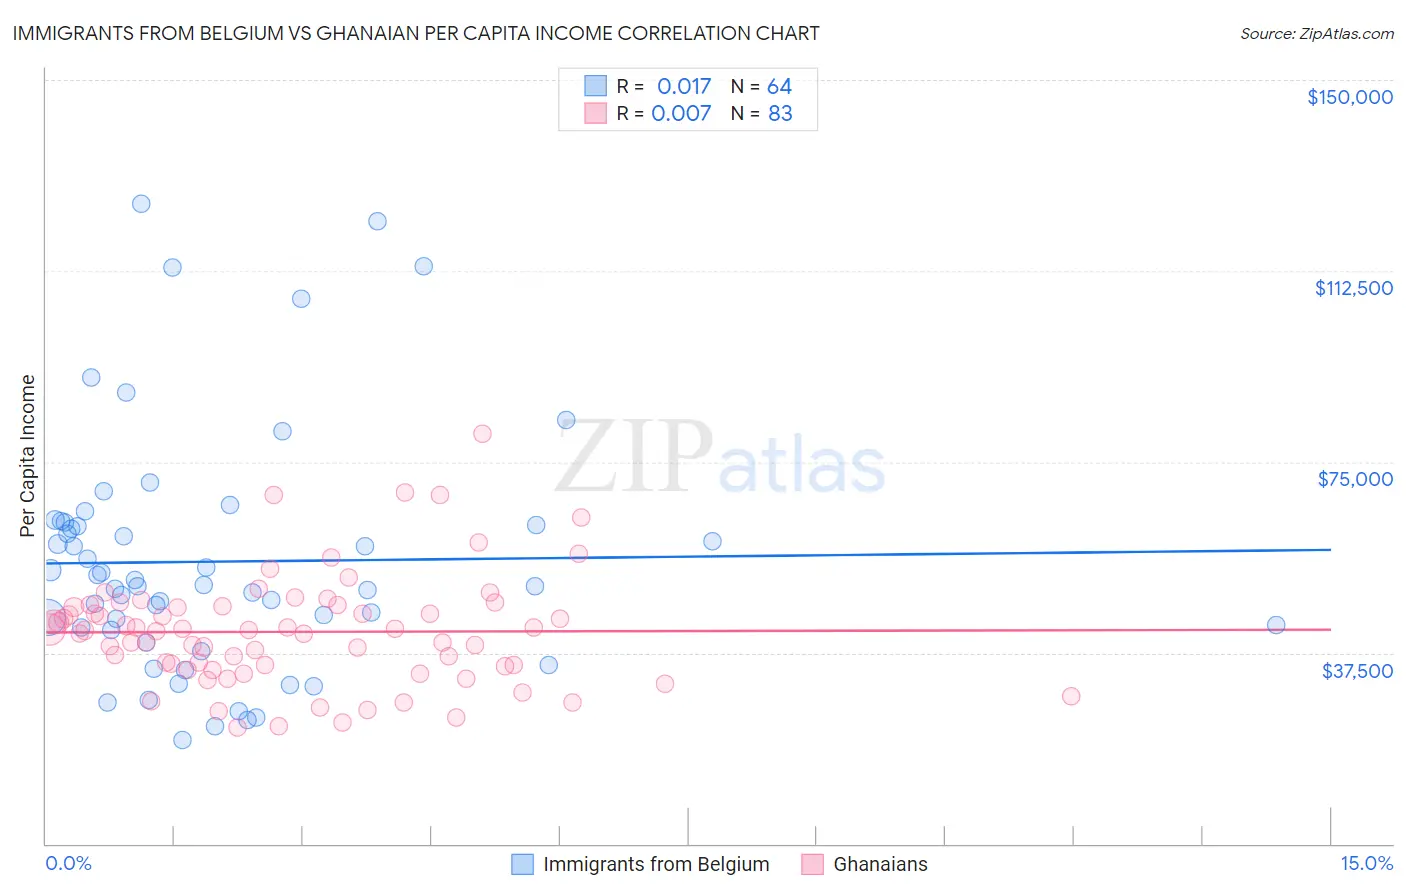
Immigrants from Belgium vs Ghanaian Per Capita Income Correlation Chart
The statistical analysis conducted on geographies consisting of 146,715,223 people shows no correlation between the proportion of Immigrants from Belgium and per capita income in the United States with a correlation coefficient (R) of 0.017 and weighted average of $55,082. Similarly, the statistical analysis conducted on geographies consisting of 190,723,780 people shows no correlation between the proportion of Ghanaians and per capita income in the United States with a correlation coefficient (R) of 0.007 and weighted average of $42,164, a difference of 30.6%.
Per Capita Income Correlation Summary
| Measurement | Immigrants from Belgium | Ghanaian |
| Minimum | $20,313 | $22,951 |
| Maximum | $125,796 | $80,537 |
| Range | $105,483 | $57,586 |
| Mean | $55,426 | $41,613 |
| Median | $50,708 | $41,877 |
| Interquartile 25% (IQ1) | $42,261 | $34,906 |
| Interquartile 75% (IQ3) | $62,896 | $46,657 |
| Interquartile Range (IQR) | $20,635 | $11,751 |
| Standard Deviation (Sample) | $23,673 | $10,874 |
| Standard Deviation (Population) | $23,487 | $10,809 |
Similar Demographics by Per Capita Income
Demographics Similar to Immigrants from Belgium by Per Capita Income
In terms of per capita income, the demographic groups most similar to Immigrants from Belgium are Cypriot ($54,899, a difference of 0.33%), Immigrants from India ($55,268, a difference of 0.34%), Immigrants from Switzerland ($54,866, a difference of 0.39%), Immigrants from Sweden ($55,582, a difference of 0.91%), and Immigrants from France ($54,557, a difference of 0.96%).
| Demographics | Rating | Rank | Per Capita Income |
| Immigrants | Israel | 100.0 /100 | #7 | Exceptional $57,384 |
| Immigrants | Hong Kong | 100.0 /100 | #8 | Exceptional $56,709 |
| Immigrants | Ireland | 100.0 /100 | #9 | Exceptional $56,584 |
| Okinawans | 100.0 /100 | #10 | Exceptional $55,817 |
| Eastern Europeans | 100.0 /100 | #11 | Exceptional $55,780 |
| Immigrants | Sweden | 100.0 /100 | #12 | Exceptional $55,582 |
| Immigrants | India | 100.0 /100 | #13 | Exceptional $55,268 |
| Immigrants | Belgium | 100.0 /100 | #14 | Exceptional $55,082 |
| Cypriots | 100.0 /100 | #15 | Exceptional $54,899 |
| Immigrants | Switzerland | 100.0 /100 | #16 | Exceptional $54,866 |
| Immigrants | France | 100.0 /100 | #17 | Exceptional $54,557 |
| Thais | 100.0 /100 | #18 | Exceptional $54,307 |
| Immigrants | China | 100.0 /100 | #19 | Exceptional $54,264 |
| Soviet Union | 100.0 /100 | #20 | Exceptional $54,202 |
| Immigrants | Northern Europe | 100.0 /100 | #21 | Exceptional $54,159 |
Demographics Similar to Ghanaians by Per Capita Income
In terms of per capita income, the demographic groups most similar to Ghanaians are White/Caucasian ($42,180, a difference of 0.040%), Aleut ($42,210, a difference of 0.11%), Spanish ($42,249, a difference of 0.20%), Venezuelan ($42,074, a difference of 0.21%), and Immigrants from Bosnia and Herzegovina ($42,278, a difference of 0.27%).
| Demographics | Rating | Rank | Per Capita Income |
| Barbadians | 19.6 /100 | #199 | Poor $42,406 |
| Vietnamese | 19.0 /100 | #200 | Poor $42,368 |
| Immigrants | Thailand | 17.6 /100 | #201 | Poor $42,289 |
| Immigrants | Bosnia and Herzegovina | 17.5 /100 | #202 | Poor $42,278 |
| Spanish | 17.0 /100 | #203 | Poor $42,249 |
| Aleuts | 16.4 /100 | #204 | Poor $42,210 |
| Whites/Caucasians | 15.9 /100 | #205 | Poor $42,180 |
| Ghanaians | 15.7 /100 | #206 | Poor $42,164 |
| Venezuelans | 14.4 /100 | #207 | Poor $42,074 |
| Panamanians | 13.9 /100 | #208 | Poor $42,035 |
| Immigrants | Sudan | 13.2 /100 | #209 | Poor $41,986 |
| Ecuadorians | 12.9 /100 | #210 | Poor $41,958 |
| Immigrants | Panama | 11.6 /100 | #211 | Poor $41,853 |
| Immigrants | Senegal | 11.3 /100 | #212 | Poor $41,830 |
| Immigrants | Venezuela | 10.2 /100 | #213 | Poor $41,727 |