Palestinian vs Ghanaian Seniors Poverty Over the Age of 75
COMPARE
Palestinian
Ghanaian
Seniors Poverty Over the Age of 75
Seniors Poverty Over the Age of 75 Comparison
Palestinians
Ghanaians
11.4%
SENIORS POVERTY OVER THE AGE OF 75
95.8/ 100
METRIC RATING
75th/ 347
METRIC RANK
14.0%
SENIORS POVERTY OVER THE AGE OF 75
0.1/ 100
METRIC RATING
261st/ 347
METRIC RANK
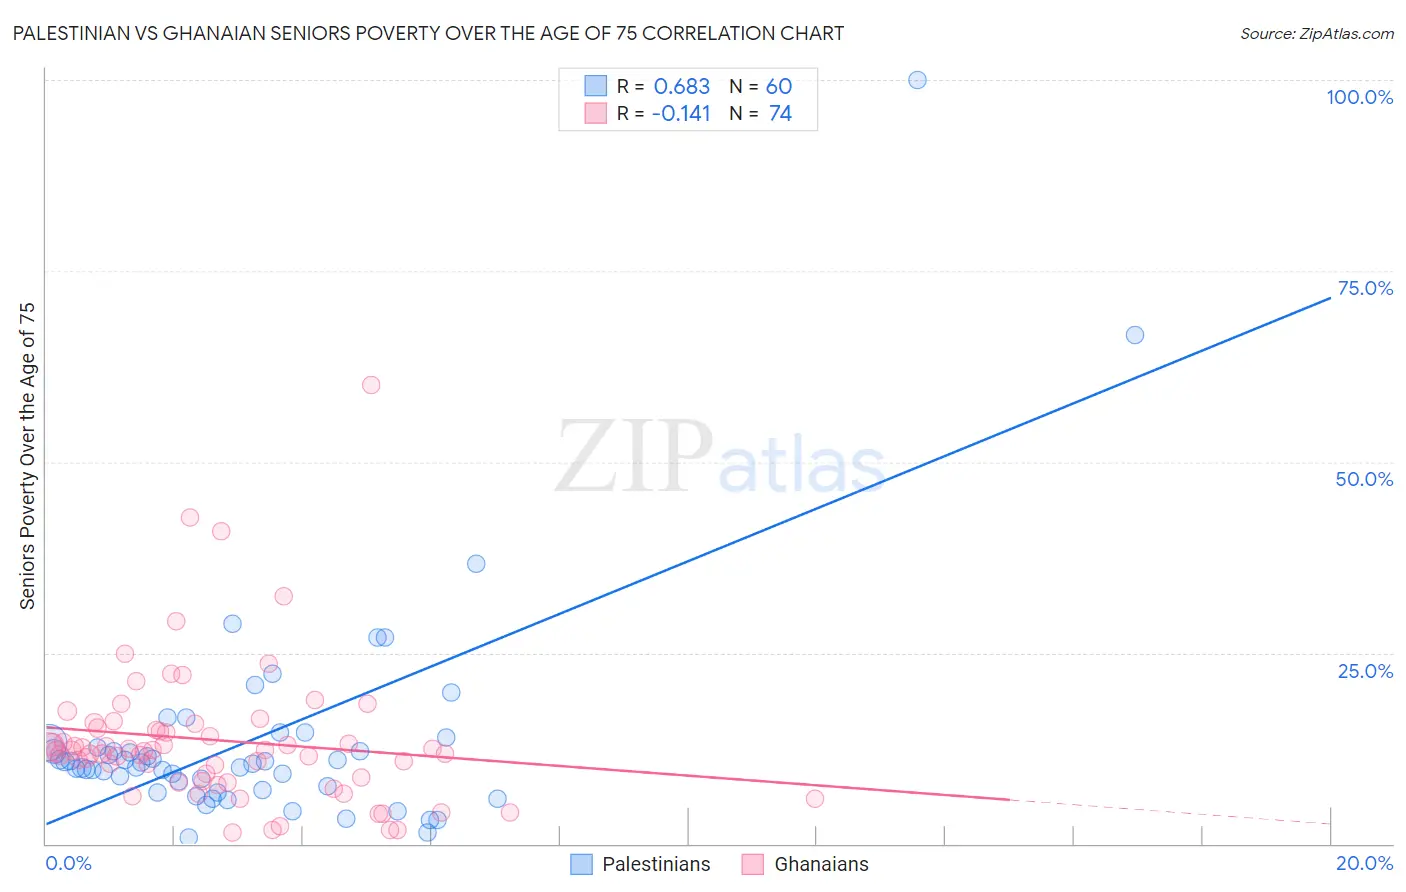
Palestinian vs Ghanaian Seniors Poverty Over the Age of 75 Correlation Chart
The statistical analysis conducted on geographies consisting of 215,392,274 people shows a significant positive correlation between the proportion of Palestinians and poverty level among seniors over the age of 75 in the United States with a correlation coefficient (R) of 0.683 and weighted average of 11.4%. Similarly, the statistical analysis conducted on geographies consisting of 189,250,390 people shows a poor negative correlation between the proportion of Ghanaians and poverty level among seniors over the age of 75 in the United States with a correlation coefficient (R) of -0.141 and weighted average of 14.0%, a difference of 22.3%.
Seniors Poverty Over the Age of 75 Correlation Summary
| Measurement | Palestinian | Ghanaian |
| Minimum | 0.80% | 1.4% |
| Maximum | 100.0% | 60.0% |
| Range | 99.2% | 58.6% |
| Mean | 13.7% | 13.5% |
| Median | 10.5% | 12.2% |
| Interquartile 25% (IQ1) | 7.3% | 8.1% |
| Interquartile 75% (IQ3) | 12.9% | 15.1% |
| Interquartile Range (IQR) | 5.7% | 7.0% |
| Standard Deviation (Sample) | 15.0% | 9.5% |
| Standard Deviation (Population) | 14.8% | 9.4% |
Similar Demographics by Seniors Poverty Over the Age of 75
Demographics Similar to Palestinians by Seniors Poverty Over the Age of 75
In terms of seniors poverty over the age of 75, the demographic groups most similar to Palestinians are French Canadian (11.4%, a difference of 0.070%), Delaware (11.4%, a difference of 0.10%), Immigrants from Micronesia (11.4%, a difference of 0.11%), White/Caucasian (11.4%, a difference of 0.15%), and Macedonian (11.4%, a difference of 0.16%).
| Demographics | Rating | Rank | Seniors Poverty Over the Age of 75 |
| Immigrants | Austria | 96.5 /100 | #68 | Exceptional 11.4% |
| Ottawa | 96.5 /100 | #69 | Exceptional 11.4% |
| Immigrants | South Central Asia | 96.4 /100 | #70 | Exceptional 11.4% |
| Osage | 96.3 /100 | #71 | Exceptional 11.4% |
| Sierra Leoneans | 96.1 /100 | #72 | Exceptional 11.4% |
| Immigrants | Micronesia | 96.0 /100 | #73 | Exceptional 11.4% |
| Delaware | 96.0 /100 | #74 | Exceptional 11.4% |
| Palestinians | 95.8 /100 | #75 | Exceptional 11.4% |
| French Canadians | 95.7 /100 | #76 | Exceptional 11.4% |
| Whites/Caucasians | 95.5 /100 | #77 | Exceptional 11.4% |
| Macedonians | 95.5 /100 | #78 | Exceptional 11.4% |
| Filipinos | 95.5 /100 | #79 | Exceptional 11.4% |
| Alaska Natives | 95.4 /100 | #80 | Exceptional 11.4% |
| Basques | 95.1 /100 | #81 | Exceptional 11.5% |
| Iranians | 95.1 /100 | #82 | Exceptional 11.5% |
Demographics Similar to Ghanaians by Seniors Poverty Over the Age of 75
In terms of seniors poverty over the age of 75, the demographic groups most similar to Ghanaians are Immigrants (13.9%, a difference of 0.10%), Immigrants from Portugal (13.9%, a difference of 0.17%), Immigrants from Panama (13.9%, a difference of 0.21%), Cajun (14.0%, a difference of 0.23%), and Immigrants from Western Africa (13.9%, a difference of 0.30%).
| Demographics | Rating | Rank | Seniors Poverty Over the Age of 75 |
| Blackfeet | 0.2 /100 | #254 | Tragic 13.7% |
| Immigrants | Belarus | 0.2 /100 | #255 | Tragic 13.8% |
| Inupiat | 0.1 /100 | #256 | Tragic 13.8% |
| Immigrants | Western Africa | 0.1 /100 | #257 | Tragic 13.9% |
| Immigrants | Panama | 0.1 /100 | #258 | Tragic 13.9% |
| Immigrants | Portugal | 0.1 /100 | #259 | Tragic 13.9% |
| Immigrants | Immigrants | 0.1 /100 | #260 | Tragic 13.9% |
| Ghanaians | 0.1 /100 | #261 | Tragic 14.0% |
| Cajuns | 0.1 /100 | #262 | Tragic 14.0% |
| Iroquois | 0.1 /100 | #263 | Tragic 14.0% |
| South Americans | 0.0 /100 | #264 | Tragic 14.1% |
| Salvadorans | 0.0 /100 | #265 | Tragic 14.2% |
| Armenians | 0.0 /100 | #266 | Tragic 14.2% |
| Venezuelans | 0.0 /100 | #267 | Tragic 14.2% |
| Colombians | 0.0 /100 | #268 | Tragic 14.3% |