Pakistani vs Lithuanian In Labor Force | Age 30-34
COMPARE
Pakistani
Lithuanian
In Labor Force | Age 30-34
In Labor Force | Age 30-34 Comparison
Pakistanis
Lithuanians
84.7%
IN LABOR FORCE | AGE 30-34
60.8/ 100
METRIC RATING
160th/ 347
METRIC RANK
85.6%
IN LABOR FORCE | AGE 30-34
99.8/ 100
METRIC RATING
49th/ 347
METRIC RANK
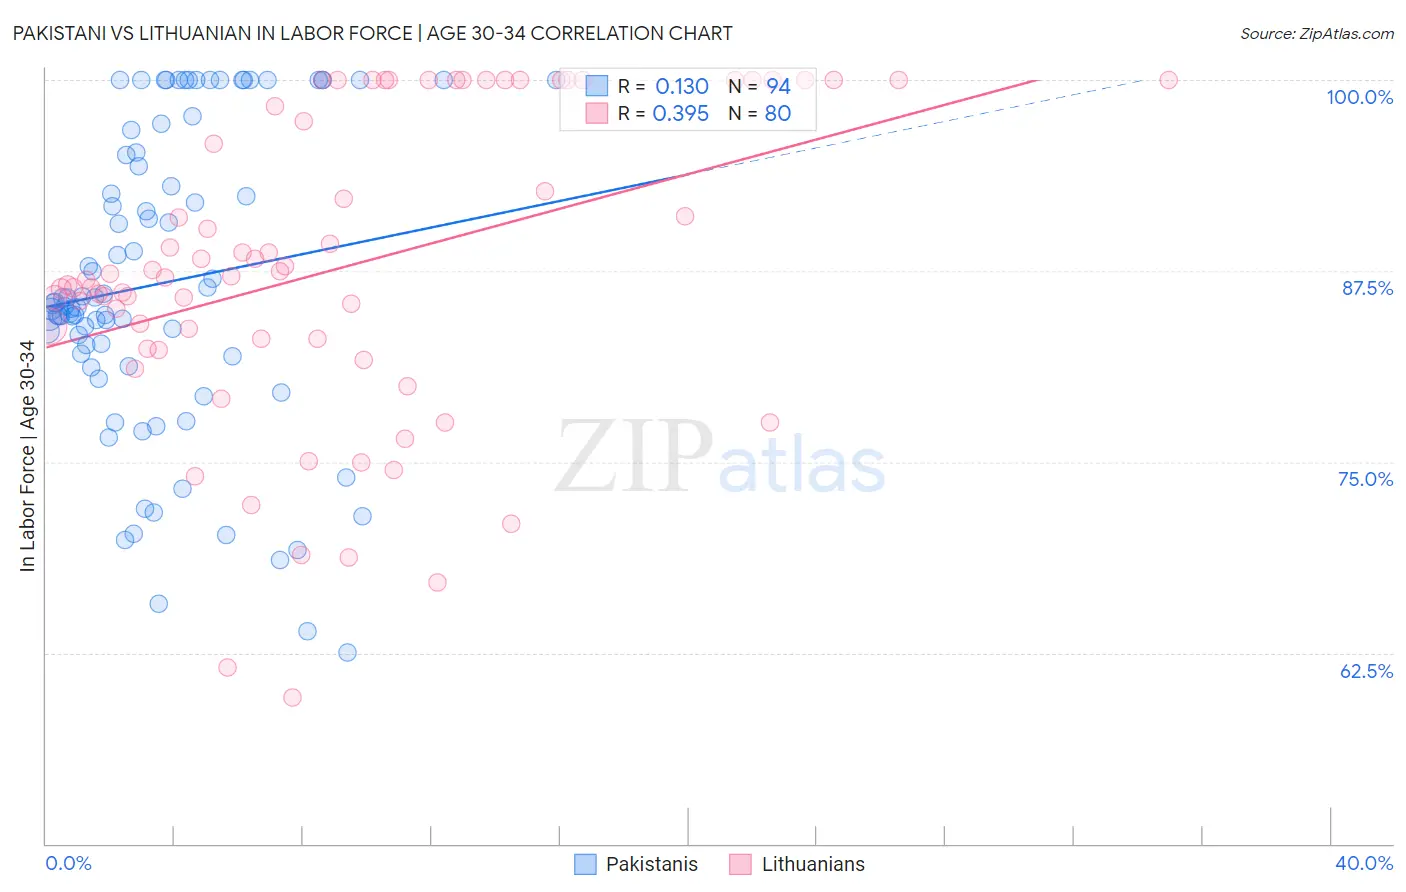
Pakistani vs Lithuanian In Labor Force | Age 30-34 Correlation Chart
The statistical analysis conducted on geographies consisting of 335,227,796 people shows a poor positive correlation between the proportion of Pakistanis and labor force participation rate among population between the ages 30 and 34 in the United States with a correlation coefficient (R) of 0.130 and weighted average of 84.7%. Similarly, the statistical analysis conducted on geographies consisting of 421,576,687 people shows a mild positive correlation between the proportion of Lithuanians and labor force participation rate among population between the ages 30 and 34 in the United States with a correlation coefficient (R) of 0.395 and weighted average of 85.6%, a difference of 0.99%.
In Labor Force | Age 30-34 Correlation Summary
| Measurement | Pakistani | Lithuanian |
| Minimum | 62.5% | 59.6% |
| Maximum | 100.0% | 100.0% |
| Range | 37.5% | 40.4% |
| Mean | 86.7% | 87.7% |
| Median | 85.4% | 87.1% |
| Interquartile 25% (IQ1) | 81.9% | 82.7% |
| Interquartile 75% (IQ3) | 95.2% | 100.0% |
| Interquartile Range (IQR) | 13.3% | 17.3% |
| Standard Deviation (Sample) | 9.9% | 10.1% |
| Standard Deviation (Population) | 9.9% | 10.0% |
Similar Demographics by In Labor Force | Age 30-34
Demographics Similar to Pakistanis by In Labor Force | Age 30-34
In terms of in labor force | age 30-34, the demographic groups most similar to Pakistanis are Immigrants from Cambodia (84.7%, a difference of 0.0%), Czechoslovakian (84.8%, a difference of 0.020%), South American (84.7%, a difference of 0.020%), Immigrants from Uruguay (84.7%, a difference of 0.020%), and Immigrants from Armenia (84.8%, a difference of 0.030%).
| Demographics | Rating | Rank | In Labor Force | Age 30-34 |
| Syrians | 70.1 /100 | #153 | Good 84.8% |
| Northern Europeans | 70.0 /100 | #154 | Good 84.8% |
| Immigrants | Sudan | 69.5 /100 | #155 | Good 84.8% |
| French Canadians | 67.3 /100 | #156 | Good 84.8% |
| Peruvians | 65.9 /100 | #157 | Good 84.8% |
| Immigrants | Armenia | 64.7 /100 | #158 | Good 84.8% |
| Czechoslovakians | 63.0 /100 | #159 | Good 84.8% |
| Pakistanis | 60.8 /100 | #160 | Good 84.7% |
| Immigrants | Cambodia | 60.7 /100 | #161 | Good 84.7% |
| South Americans | 58.7 /100 | #162 | Average 84.7% |
| Immigrants | Uruguay | 57.4 /100 | #163 | Average 84.7% |
| Icelanders | 56.8 /100 | #164 | Average 84.7% |
| Immigrants | Western Europe | 56.7 /100 | #165 | Average 84.7% |
| Afghans | 55.2 /100 | #166 | Average 84.7% |
| Immigrants | South Eastern Asia | 54.2 /100 | #167 | Average 84.7% |
Demographics Similar to Lithuanians by In Labor Force | Age 30-34
In terms of in labor force | age 30-34, the demographic groups most similar to Lithuanians are Immigrants from Sweden (85.6%, a difference of 0.010%), Immigrants from Australia (85.6%, a difference of 0.010%), Immigrants from Morocco (85.6%, a difference of 0.020%), Croatian (85.6%, a difference of 0.020%), and Immigrants from Nepal (85.6%, a difference of 0.030%).
| Demographics | Rating | Rank | In Labor Force | Age 30-34 |
| Zimbabweans | 99.8 /100 | #42 | Exceptional 85.6% |
| Immigrants | Lithuania | 99.8 /100 | #43 | Exceptional 85.6% |
| Immigrants | Sri Lanka | 99.8 /100 | #44 | Exceptional 85.6% |
| Immigrants | Nepal | 99.8 /100 | #45 | Exceptional 85.6% |
| Immigrants | Morocco | 99.8 /100 | #46 | Exceptional 85.6% |
| Croatians | 99.8 /100 | #47 | Exceptional 85.6% |
| Immigrants | Sweden | 99.8 /100 | #48 | Exceptional 85.6% |
| Lithuanians | 99.8 /100 | #49 | Exceptional 85.6% |
| Immigrants | Australia | 99.8 /100 | #50 | Exceptional 85.6% |
| Cape Verdeans | 99.7 /100 | #51 | Exceptional 85.6% |
| Slovenes | 99.7 /100 | #52 | Exceptional 85.6% |
| Filipinos | 99.6 /100 | #53 | Exceptional 85.5% |
| Immigrants | Kenya | 99.6 /100 | #54 | Exceptional 85.5% |
| Immigrants | Turkey | 99.6 /100 | #55 | Exceptional 85.5% |
| Czechs | 99.6 /100 | #56 | Exceptional 85.5% |