Pakistani vs Lithuanian Female Unemployment
COMPARE
Pakistani
Lithuanian
Female Unemployment
Female Unemployment Comparison
Pakistanis
Lithuanians
5.1%
FEMALE UNEMPLOYMENT
83.8/ 100
METRIC RATING
137th/ 347
METRIC RANK
4.7%
FEMALE UNEMPLOYMENT
99.8/ 100
METRIC RATING
30th/ 347
METRIC RANK
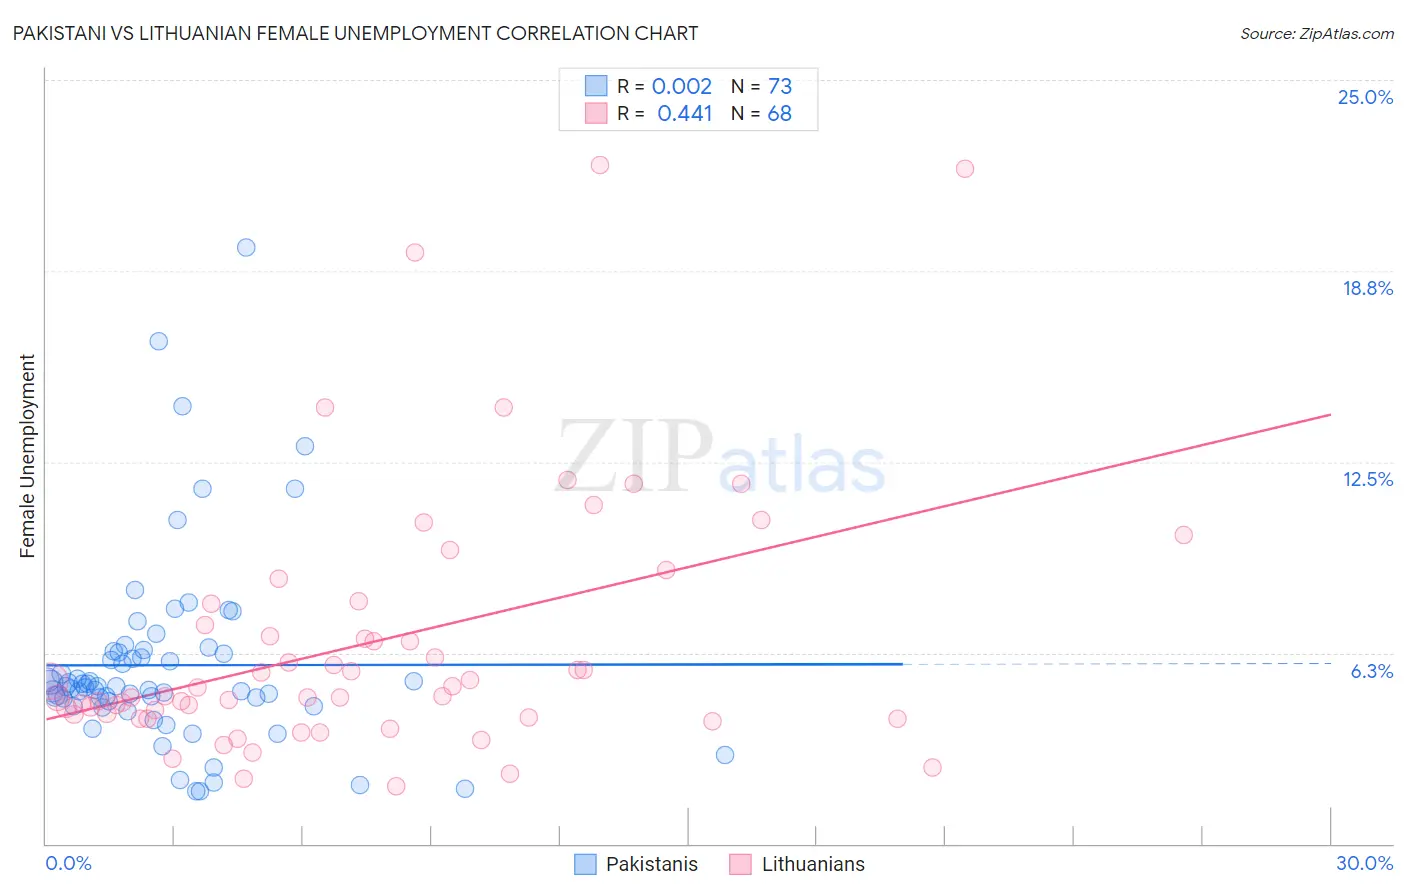
Pakistani vs Lithuanian Female Unemployment Correlation Chart
The statistical analysis conducted on geographies consisting of 334,292,014 people shows no correlation between the proportion of Pakistanis and unemploymnet rate among females in the United States with a correlation coefficient (R) of 0.002 and weighted average of 5.1%. Similarly, the statistical analysis conducted on geographies consisting of 418,507,146 people shows a moderate positive correlation between the proportion of Lithuanians and unemploymnet rate among females in the United States with a correlation coefficient (R) of 0.441 and weighted average of 4.7%, a difference of 8.1%.
Female Unemployment Correlation Summary
| Measurement | Pakistani | Lithuanian |
| Minimum | 1.7% | 1.9% |
| Maximum | 19.5% | 22.2% |
| Range | 17.8% | 20.3% |
| Mean | 5.8% | 6.6% |
| Median | 5.1% | 4.8% |
| Interquartile 25% (IQ1) | 4.6% | 4.2% |
| Interquartile 75% (IQ3) | 6.3% | 7.5% |
| Interquartile Range (IQR) | 1.7% | 3.3% |
| Standard Deviation (Sample) | 3.1% | 4.3% |
| Standard Deviation (Population) | 3.1% | 4.2% |
Similar Demographics by Female Unemployment
Demographics Similar to Pakistanis by Female Unemployment
In terms of female unemployment, the demographic groups most similar to Pakistanis are Indian (Asian) (5.1%, a difference of 0.040%), Chickasaw (5.1%, a difference of 0.060%), Immigrants from Eastern Asia (5.1%, a difference of 0.080%), Immigrants from Eritrea (5.1%, a difference of 0.090%), and Immigrants from Latvia (5.1%, a difference of 0.090%).
| Demographics | Rating | Rank | Female Unemployment |
| Maltese | 85.5 /100 | #130 | Excellent 5.1% |
| Immigrants | Ethiopia | 85.4 /100 | #131 | Excellent 5.1% |
| Immigrants | Sri Lanka | 85.0 /100 | #132 | Excellent 5.1% |
| Immigrants | Hong Kong | 84.8 /100 | #133 | Excellent 5.1% |
| Immigrants | Eritrea | 84.6 /100 | #134 | Excellent 5.1% |
| Immigrants | Latvia | 84.6 /100 | #135 | Excellent 5.1% |
| Indians (Asian) | 84.2 /100 | #136 | Excellent 5.1% |
| Pakistanis | 83.8 /100 | #137 | Excellent 5.1% |
| Chickasaw | 83.2 /100 | #138 | Excellent 5.1% |
| Immigrants | Eastern Asia | 83.0 /100 | #139 | Excellent 5.1% |
| Immigrants | France | 82.7 /100 | #140 | Excellent 5.1% |
| Immigrants | Eastern Europe | 81.5 /100 | #141 | Excellent 5.1% |
| Palestinians | 80.8 /100 | #142 | Excellent 5.1% |
| Immigrants | Kazakhstan | 80.7 /100 | #143 | Excellent 5.1% |
| Immigrants | Jordan | 80.4 /100 | #144 | Excellent 5.1% |
Demographics Similar to Lithuanians by Female Unemployment
In terms of female unemployment, the demographic groups most similar to Lithuanians are Cypriot (4.7%, a difference of 0.12%), Irish (4.7%, a difference of 0.13%), British (4.7%, a difference of 0.16%), Sudanese (4.8%, a difference of 0.28%), and Immigrants from Bosnia and Herzegovina (4.7%, a difference of 0.33%).
| Demographics | Rating | Rank | Female Unemployment |
| Scottish | 99.9 /100 | #23 | Exceptional 4.7% |
| Welsh | 99.9 /100 | #24 | Exceptional 4.7% |
| Immigrants | India | 99.9 /100 | #25 | Exceptional 4.7% |
| Immigrants | Bosnia and Herzegovina | 99.9 /100 | #26 | Exceptional 4.7% |
| British | 99.9 /100 | #27 | Exceptional 4.7% |
| Irish | 99.9 /100 | #28 | Exceptional 4.7% |
| Cypriots | 99.9 /100 | #29 | Exceptional 4.7% |
| Lithuanians | 99.8 /100 | #30 | Exceptional 4.7% |
| Sudanese | 99.8 /100 | #31 | Exceptional 4.8% |
| Slovaks | 99.8 /100 | #32 | Exceptional 4.8% |
| Czechoslovakians | 99.7 /100 | #33 | Exceptional 4.8% |
| Zimbabweans | 99.7 /100 | #34 | Exceptional 4.8% |
| French Canadians | 99.7 /100 | #35 | Exceptional 4.8% |
| Yugoslavians | 99.7 /100 | #36 | Exceptional 4.8% |
| Pennsylvania Germans | 99.6 /100 | #37 | Exceptional 4.8% |