Hawaiian vs Immigrants from Lithuania Median Earnings
COMPARE
Hawaiian
Immigrants from Lithuania
Median Earnings
Median Earnings Comparison
Hawaiians
Immigrants from Lithuania
$43,673
MEDIAN EARNINGS
2.0/ 100
METRIC RATING
252nd/ 347
METRIC RANK
$52,769
MEDIAN EARNINGS
100.0/ 100
METRIC RATING
41st/ 347
METRIC RANK
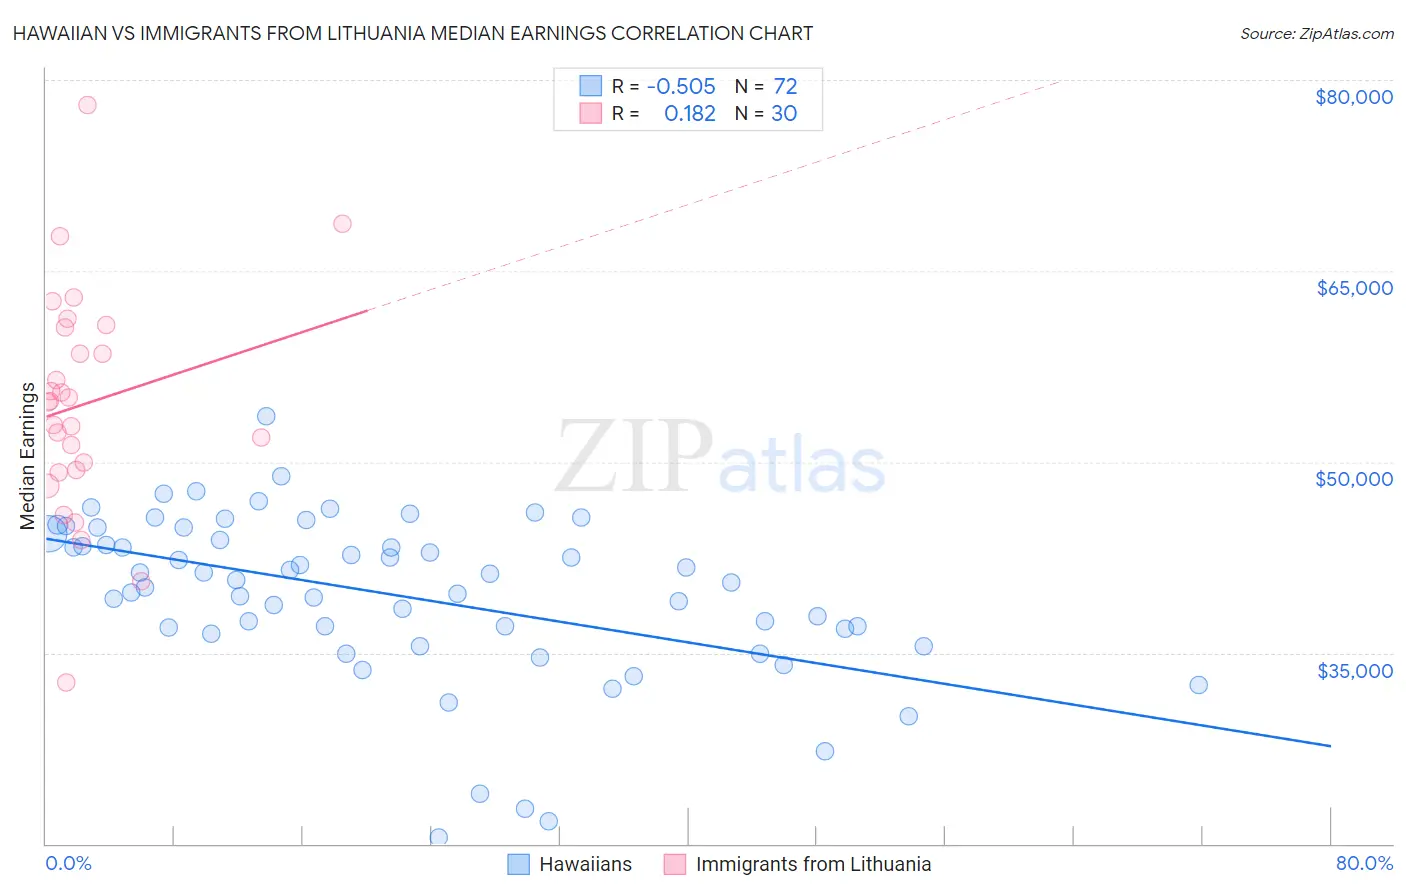
Hawaiian vs Immigrants from Lithuania Median Earnings Correlation Chart
The statistical analysis conducted on geographies consisting of 327,597,222 people shows a substantial negative correlation between the proportion of Hawaiians and median earnings in the United States with a correlation coefficient (R) of -0.505 and weighted average of $43,673. Similarly, the statistical analysis conducted on geographies consisting of 117,724,669 people shows a poor positive correlation between the proportion of Immigrants from Lithuania and median earnings in the United States with a correlation coefficient (R) of 0.182 and weighted average of $52,769, a difference of 20.8%.
Median Earnings Correlation Summary
| Measurement | Hawaiian | Immigrants from Lithuania |
| Minimum | $20,530 | $32,646 |
| Maximum | $53,613 | $78,046 |
| Range | $33,083 | $45,400 |
| Mean | $39,525 | $54,582 |
| Median | $40,637 | $54,749 |
| Interquartile 25% (IQ1) | $36,694 | $49,388 |
| Interquartile 75% (IQ3) | $44,126 | $60,605 |
| Interquartile Range (IQR) | $7,432 | $11,217 |
| Standard Deviation (Sample) | $6,473 | $8,932 |
| Standard Deviation (Population) | $6,428 | $8,782 |
Similar Demographics by Median Earnings
Demographics Similar to Hawaiians by Median Earnings
In terms of median earnings, the demographic groups most similar to Hawaiians are Tsimshian ($43,695, a difference of 0.050%), Alaska Native ($43,750, a difference of 0.18%), Somali ($43,567, a difference of 0.24%), Liberian ($43,536, a difference of 0.31%), and Malaysian ($43,844, a difference of 0.39%).
| Demographics | Rating | Rank | Median Earnings |
| Immigrants | Burma/Myanmar | 3.2 /100 | #245 | Tragic $43,998 |
| Immigrants | West Indies | 3.1 /100 | #246 | Tragic $43,989 |
| Immigrants | Cabo Verde | 3.0 /100 | #247 | Tragic $43,963 |
| Nepalese | 2.6 /100 | #248 | Tragic $43,860 |
| Malaysians | 2.6 /100 | #249 | Tragic $43,844 |
| Alaska Natives | 2.3 /100 | #250 | Tragic $43,750 |
| Tsimshian | 2.1 /100 | #251 | Tragic $43,695 |
| Hawaiians | 2.0 /100 | #252 | Tragic $43,673 |
| Somalis | 1.8 /100 | #253 | Tragic $43,567 |
| Liberians | 1.7 /100 | #254 | Tragic $43,536 |
| Immigrants | Middle Africa | 1.4 /100 | #255 | Tragic $43,416 |
| Alaskan Athabascans | 1.4 /100 | #256 | Tragic $43,393 |
| Jamaicans | 1.3 /100 | #257 | Tragic $43,343 |
| French American Indians | 1.3 /100 | #258 | Tragic $43,333 |
| German Russians | 1.1 /100 | #259 | Tragic $43,200 |
Demographics Similar to Immigrants from Lithuania by Median Earnings
In terms of median earnings, the demographic groups most similar to Immigrants from Lithuania are Israeli ($52,937, a difference of 0.32%), Immigrants from Turkey ($52,960, a difference of 0.36%), Latvian ($53,001, a difference of 0.44%), Maltese ($52,526, a difference of 0.46%), and Immigrants from Malaysia ($52,514, a difference of 0.49%).
| Demographics | Rating | Rank | Median Earnings |
| Immigrants | Sri Lanka | 100.0 /100 | #34 | Exceptional $53,268 |
| Immigrants | Switzerland | 100.0 /100 | #35 | Exceptional $53,211 |
| Immigrants | Denmark | 100.0 /100 | #36 | Exceptional $53,186 |
| Immigrants | Belarus | 100.0 /100 | #37 | Exceptional $53,043 |
| Latvians | 100.0 /100 | #38 | Exceptional $53,001 |
| Immigrants | Turkey | 100.0 /100 | #39 | Exceptional $52,960 |
| Israelis | 100.0 /100 | #40 | Exceptional $52,937 |
| Immigrants | Lithuania | 100.0 /100 | #41 | Exceptional $52,769 |
| Maltese | 100.0 /100 | #42 | Exceptional $52,526 |
| Immigrants | Malaysia | 100.0 /100 | #43 | Exceptional $52,514 |
| Bulgarians | 100.0 /100 | #44 | Exceptional $52,512 |
| Immigrants | Czechoslovakia | 100.0 /100 | #45 | Exceptional $52,361 |
| Bhutanese | 100.0 /100 | #46 | Exceptional $52,297 |
| Australians | 100.0 /100 | #47 | Exceptional $52,294 |
| Immigrants | Europe | 100.0 /100 | #48 | Exceptional $52,195 |