Immigrants from Serbia vs Immigrants from Lithuania Median Earnings
COMPARE
Immigrants from Serbia
Immigrants from Lithuania
Median Earnings
Median Earnings Comparison
Immigrants from Serbia
Immigrants from Lithuania
$51,557
MEDIAN EARNINGS
99.9/ 100
METRIC RATING
60th/ 347
METRIC RANK
$52,769
MEDIAN EARNINGS
100.0/ 100
METRIC RATING
41st/ 347
METRIC RANK
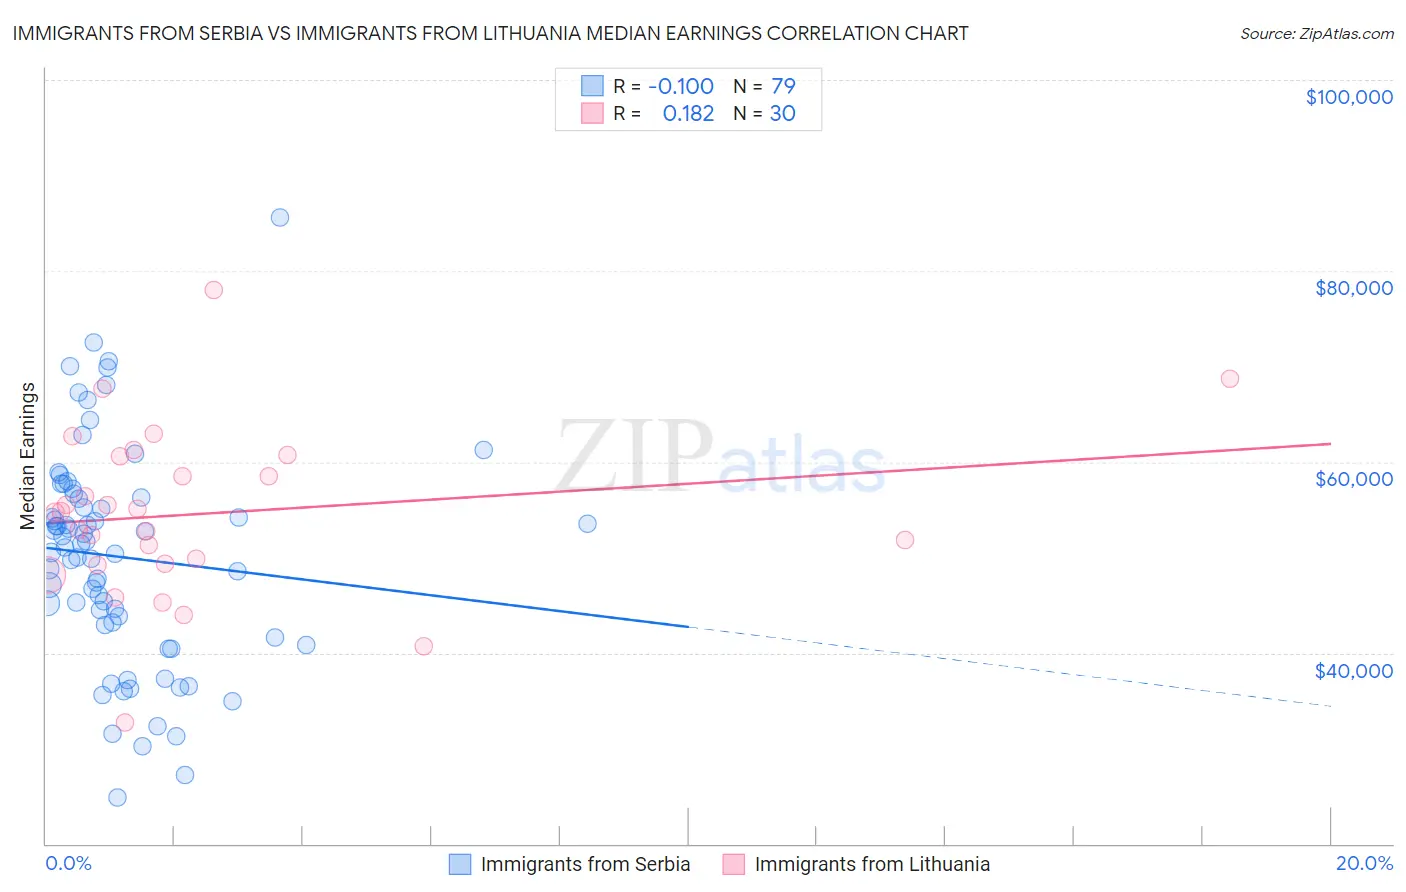
Immigrants from Serbia vs Immigrants from Lithuania Median Earnings Correlation Chart
The statistical analysis conducted on geographies consisting of 131,742,589 people shows a slight negative correlation between the proportion of Immigrants from Serbia and median earnings in the United States with a correlation coefficient (R) of -0.100 and weighted average of $51,557. Similarly, the statistical analysis conducted on geographies consisting of 117,724,669 people shows a poor positive correlation between the proportion of Immigrants from Lithuania and median earnings in the United States with a correlation coefficient (R) of 0.182 and weighted average of $52,769, a difference of 2.4%.
Median Earnings Correlation Summary
| Measurement | Immigrants from Serbia | Immigrants from Lithuania |
| Minimum | $24,850 | $32,646 |
| Maximum | $85,578 | $78,046 |
| Range | $60,728 | $45,400 |
| Mean | $50,027 | $54,582 |
| Median | $50,986 | $54,749 |
| Interquartile 25% (IQ1) | $42,944 | $49,388 |
| Interquartile 75% (IQ3) | $56,219 | $60,605 |
| Interquartile Range (IQR) | $13,275 | $11,217 |
| Standard Deviation (Sample) | $11,396 | $8,932 |
| Standard Deviation (Population) | $11,323 | $8,782 |
Demographics Similar to Immigrants from Serbia and Immigrants from Lithuania by Median Earnings
In terms of median earnings, the demographic groups most similar to Immigrants from Serbia are Immigrants from Croatia ($51,581, a difference of 0.050%), Immigrants from Bolivia ($51,605, a difference of 0.090%), Immigrants from Eastern Europe ($51,624, a difference of 0.13%), Immigrants from Pakistan ($51,693, a difference of 0.26%), and Egyptian ($51,701, a difference of 0.28%). Similarly, the demographic groups most similar to Immigrants from Lithuania are Israeli ($52,937, a difference of 0.32%), Maltese ($52,526, a difference of 0.46%), Immigrants from Malaysia ($52,514, a difference of 0.49%), Bulgarian ($52,512, a difference of 0.49%), and Immigrants from Czechoslovakia ($52,361, a difference of 0.78%).
| Demographics | Rating | Rank | Median Earnings |
| Israelis | 100.0 /100 | #40 | Exceptional $52,937 |
| Immigrants | Lithuania | 100.0 /100 | #41 | Exceptional $52,769 |
| Maltese | 100.0 /100 | #42 | Exceptional $52,526 |
| Immigrants | Malaysia | 100.0 /100 | #43 | Exceptional $52,514 |
| Bulgarians | 100.0 /100 | #44 | Exceptional $52,512 |
| Immigrants | Czechoslovakia | 100.0 /100 | #45 | Exceptional $52,361 |
| Bhutanese | 100.0 /100 | #46 | Exceptional $52,297 |
| Australians | 100.0 /100 | #47 | Exceptional $52,294 |
| Immigrants | Europe | 100.0 /100 | #48 | Exceptional $52,195 |
| Bolivians | 100.0 /100 | #49 | Exceptional $52,005 |
| Immigrants | South Africa | 100.0 /100 | #50 | Exceptional $51,850 |
| Immigrants | Austria | 99.9 /100 | #51 | Exceptional $51,826 |
| Estonians | 99.9 /100 | #52 | Exceptional $51,772 |
| Immigrants | Norway | 99.9 /100 | #53 | Exceptional $51,758 |
| Immigrants | Indonesia | 99.9 /100 | #54 | Exceptional $51,715 |
| Egyptians | 99.9 /100 | #55 | Exceptional $51,701 |
| Immigrants | Pakistan | 99.9 /100 | #56 | Exceptional $51,693 |
| Immigrants | Eastern Europe | 99.9 /100 | #57 | Exceptional $51,624 |
| Immigrants | Bolivia | 99.9 /100 | #58 | Exceptional $51,605 |
| Immigrants | Croatia | 99.9 /100 | #59 | Exceptional $51,581 |
| Immigrants | Serbia | 99.9 /100 | #60 | Exceptional $51,557 |