Ottawa vs Immigrants from Lithuania Unemployment Among Women with Children Ages 6 to 17 years
COMPARE
Ottawa
Immigrants from Lithuania
Unemployment Among Women with Children Ages 6 to 17 years
Unemployment Among Women with Children Ages 6 to 17 years Comparison
Ottawa
Immigrants from Lithuania
10.9%
UNEMPLOYMENT AMONG WOMEN WITH CHILDREN AGES 6 TO 17 YEARS
0.0/ 100
METRIC RATING
328th/ 347
METRIC RANK
8.6%
UNEMPLOYMENT AMONG WOMEN WITH CHILDREN AGES 6 TO 17 YEARS
98.4/ 100
METRIC RATING
99th/ 347
METRIC RANK
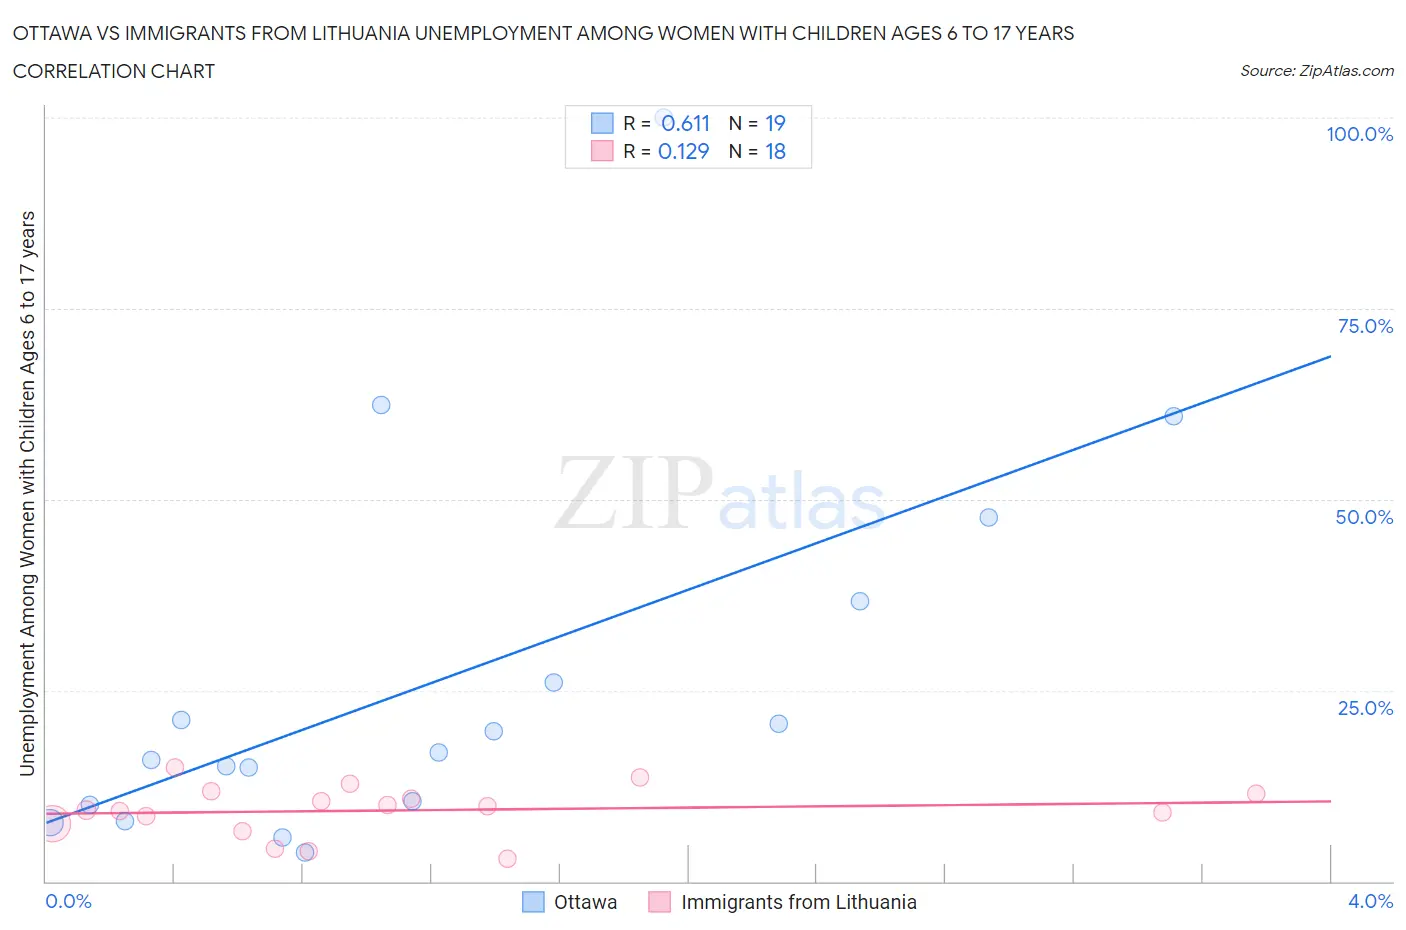
Ottawa vs Immigrants from Lithuania Unemployment Among Women with Children Ages 6 to 17 years Correlation Chart
The statistical analysis conducted on geographies consisting of 42,886,423 people shows a significant positive correlation between the proportion of Ottawa and unemployment rate among women with children between the ages 6 and 17 in the United States with a correlation coefficient (R) of 0.611 and weighted average of 10.9%. Similarly, the statistical analysis conducted on geographies consisting of 97,683,063 people shows a poor positive correlation between the proportion of Immigrants from Lithuania and unemployment rate among women with children between the ages 6 and 17 in the United States with a correlation coefficient (R) of 0.129 and weighted average of 8.6%, a difference of 27.1%.
Unemployment Among Women with Children Ages 6 to 17 years Correlation Summary
| Measurement | Ottawa | Immigrants from Lithuania |
| Minimum | 3.7% | 3.0% |
| Maximum | 100.0% | 14.9% |
| Range | 96.3% | 12.0% |
| Mean | 26.5% | 9.3% |
| Median | 16.8% | 9.6% |
| Interquartile 25% (IQ1) | 10.0% | 7.5% |
| Interquartile 75% (IQ3) | 36.6% | 11.5% |
| Interquartile Range (IQR) | 26.6% | 4.0% |
| Standard Deviation (Sample) | 24.9% | 3.3% |
| Standard Deviation (Population) | 24.3% | 3.2% |
Similar Demographics by Unemployment Among Women with Children Ages 6 to 17 years
Demographics Similar to Ottawa by Unemployment Among Women with Children Ages 6 to 17 years
In terms of unemployment among women with children ages 6 to 17 years, the demographic groups most similar to Ottawa are Cape Verdean (10.9%, a difference of 0.14%), Liberian (10.8%, a difference of 0.20%), Cajun (10.8%, a difference of 0.27%), Immigrants from Dominican Republic (10.8%, a difference of 0.46%), and Dominican (10.8%, a difference of 0.52%).
| Demographics | Rating | Rank | Unemployment Among Women with Children Ages 6 to 17 years |
| Tohono O'odham | 0.0 /100 | #321 | Tragic 10.7% |
| Cree | 0.0 /100 | #322 | Tragic 10.8% |
| Dominicans | 0.0 /100 | #323 | Tragic 10.8% |
| Immigrants | Dominican Republic | 0.0 /100 | #324 | Tragic 10.8% |
| Cajuns | 0.0 /100 | #325 | Tragic 10.8% |
| Liberians | 0.0 /100 | #326 | Tragic 10.8% |
| Cape Verdeans | 0.0 /100 | #327 | Tragic 10.9% |
| Ottawa | 0.0 /100 | #328 | Tragic 10.9% |
| Pennsylvania Germans | 0.0 /100 | #329 | Tragic 11.0% |
| Chippewa | 0.0 /100 | #330 | Tragic 11.1% |
| Blacks/African Americans | 0.0 /100 | #331 | Tragic 11.4% |
| Tsimshian | 0.0 /100 | #332 | Tragic 11.4% |
| Natives/Alaskans | 0.0 /100 | #333 | Tragic 11.5% |
| Ugandans | 0.0 /100 | #334 | Tragic 12.0% |
| Colville | 0.0 /100 | #335 | Tragic 12.3% |
Demographics Similar to Immigrants from Lithuania by Unemployment Among Women with Children Ages 6 to 17 years
In terms of unemployment among women with children ages 6 to 17 years, the demographic groups most similar to Immigrants from Lithuania are New Zealander (8.6%, a difference of 0.0%), Immigrants from Pakistan (8.6%, a difference of 0.0%), Immigrants from South Africa (8.6%, a difference of 0.030%), Scandinavian (8.6%, a difference of 0.040%), and Malaysian (8.6%, a difference of 0.080%).
| Demographics | Rating | Rank | Unemployment Among Women with Children Ages 6 to 17 years |
| Potawatomi | 99.0 /100 | #92 | Exceptional 8.5% |
| Australians | 98.9 /100 | #93 | Exceptional 8.5% |
| Immigrants | Barbados | 98.8 /100 | #94 | Exceptional 8.5% |
| Sri Lankans | 98.7 /100 | #95 | Exceptional 8.5% |
| German Russians | 98.6 /100 | #96 | Exceptional 8.5% |
| Bolivians | 98.5 /100 | #97 | Exceptional 8.5% |
| Malaysians | 98.5 /100 | #98 | Exceptional 8.6% |
| Immigrants | Lithuania | 98.4 /100 | #99 | Exceptional 8.6% |
| New Zealanders | 98.4 /100 | #100 | Exceptional 8.6% |
| Immigrants | Pakistan | 98.4 /100 | #101 | Exceptional 8.6% |
| Immigrants | South Africa | 98.3 /100 | #102 | Exceptional 8.6% |
| Scandinavians | 98.3 /100 | #103 | Exceptional 8.6% |
| Immigrants | France | 98.0 /100 | #104 | Exceptional 8.6% |
| Immigrants | Norway | 97.8 /100 | #105 | Exceptional 8.6% |
| Immigrants | Serbia | 97.7 /100 | #106 | Exceptional 8.6% |