Osage vs Russian Child Poverty Under the Age of 5
COMPARE
Osage
Russian
Child Poverty Under the Age of 5
Child Poverty Under the Age of 5 Comparison
Osage
Russians
19.6%
CHILD POVERTY UNDER THE AGE OF 5
0.5/ 100
METRIC RATING
243rd/ 347
METRIC RANK
14.8%
CHILD POVERTY UNDER THE AGE OF 5
99.6/ 100
METRIC RATING
47th/ 347
METRIC RANK
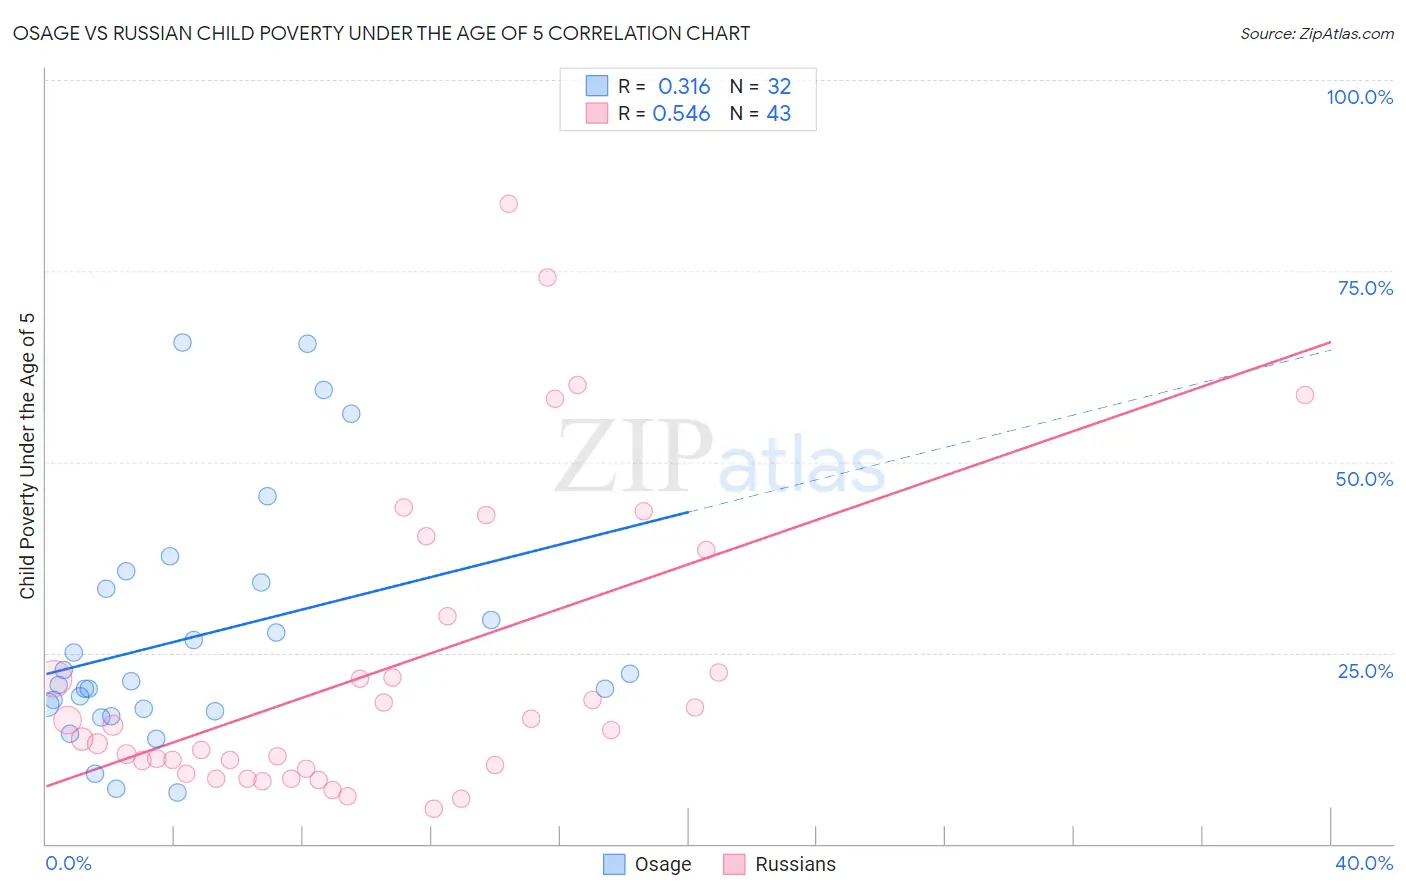
Osage vs Russian Child Poverty Under the Age of 5 Correlation Chart
The statistical analysis conducted on geographies consisting of 90,936,218 people shows a mild positive correlation between the proportion of Osage and poverty level among children under the age of 5 in the United States with a correlation coefficient (R) of 0.316 and weighted average of 19.6%. Similarly, the statistical analysis conducted on geographies consisting of 480,244,967 people shows a substantial positive correlation between the proportion of Russians and poverty level among children under the age of 5 in the United States with a correlation coefficient (R) of 0.546 and weighted average of 14.8%, a difference of 33.1%.
Child Poverty Under the Age of 5 Correlation Summary
| Measurement | Osage | Russian |
| Minimum | 6.7% | 4.6% |
| Maximum | 65.6% | 83.9% |
| Range | 59.0% | 79.3% |
| Mean | 27.0% | 22.8% |
| Median | 21.0% | 14.8% |
| Interquartile 25% (IQ1) | 17.5% | 9.9% |
| Interquartile 75% (IQ3) | 33.8% | 29.7% |
| Interquartile Range (IQR) | 16.2% | 19.8% |
| Standard Deviation (Sample) | 15.9% | 19.7% |
| Standard Deviation (Population) | 15.6% | 19.4% |
Similar Demographics by Child Poverty Under the Age of 5
Demographics Similar to Osage by Child Poverty Under the Age of 5
In terms of child poverty under the age of 5, the demographic groups most similar to Osage are Immigrants from Ghana (19.6%, a difference of 0.020%), Immigrants from Guyana (19.6%, a difference of 0.10%), Immigrants from Western Africa (19.7%, a difference of 0.21%), Alaska Native (19.6%, a difference of 0.22%), and Immigrants from Ecuador (19.6%, a difference of 0.28%).
| Demographics | Rating | Rank | Child Poverty Under the Age of 5 |
| Immigrants | Trinidad and Tobago | 0.8 /100 | #236 | Tragic 19.4% |
| Immigrants | Cabo Verde | 0.6 /100 | #237 | Tragic 19.5% |
| Salvadorans | 0.6 /100 | #238 | Tragic 19.5% |
| Vietnamese | 0.6 /100 | #239 | Tragic 19.5% |
| Immigrants | Ecuador | 0.5 /100 | #240 | Tragic 19.6% |
| Alaska Natives | 0.5 /100 | #241 | Tragic 19.6% |
| Immigrants | Guyana | 0.5 /100 | #242 | Tragic 19.6% |
| Osage | 0.5 /100 | #243 | Tragic 19.6% |
| Immigrants | Ghana | 0.5 /100 | #244 | Tragic 19.6% |
| Immigrants | Western Africa | 0.4 /100 | #245 | Tragic 19.7% |
| Cree | 0.4 /100 | #246 | Tragic 19.7% |
| Guyanese | 0.4 /100 | #247 | Tragic 19.7% |
| Marshallese | 0.4 /100 | #248 | Tragic 19.7% |
| Immigrants | Middle Africa | 0.4 /100 | #249 | Tragic 19.7% |
| Immigrants | Nonimmigrants | 0.4 /100 | #250 | Tragic 19.7% |
Demographics Similar to Russians by Child Poverty Under the Age of 5
In terms of child poverty under the age of 5, the demographic groups most similar to Russians are Immigrants from Czechoslovakia (14.8%, a difference of 0.11%), Tsimshian (14.7%, a difference of 0.14%), Laotian (14.7%, a difference of 0.21%), Immigrants from Bulgaria (14.8%, a difference of 0.26%), and Immigrants from Philippines (14.7%, a difference of 0.34%).
| Demographics | Rating | Rank | Child Poverty Under the Age of 5 |
| Immigrants | Australia | 99.7 /100 | #40 | Exceptional 14.6% |
| Immigrants | Belarus | 99.7 /100 | #41 | Exceptional 14.7% |
| Soviet Union | 99.7 /100 | #42 | Exceptional 14.7% |
| Immigrants | Greece | 99.7 /100 | #43 | Exceptional 14.7% |
| Immigrants | Philippines | 99.7 /100 | #44 | Exceptional 14.7% |
| Laotians | 99.6 /100 | #45 | Exceptional 14.7% |
| Tsimshian | 99.6 /100 | #46 | Exceptional 14.7% |
| Russians | 99.6 /100 | #47 | Exceptional 14.8% |
| Immigrants | Czechoslovakia | 99.6 /100 | #48 | Exceptional 14.8% |
| Immigrants | Bulgaria | 99.6 /100 | #49 | Exceptional 14.8% |
| Immigrants | Northern Europe | 99.6 /100 | #50 | Exceptional 14.8% |
| Estonians | 99.6 /100 | #51 | Exceptional 14.8% |
| Immigrants | Serbia | 99.5 /100 | #52 | Exceptional 14.9% |
| Luxembourgers | 99.4 /100 | #53 | Exceptional 14.9% |
| Immigrants | Israel | 99.4 /100 | #54 | Exceptional 14.9% |