Immigrants from Liberia vs Russian Per Capita Income
COMPARE
Immigrants from Liberia
Russian
Per Capita Income
Per Capita Income Comparison
Immigrants from Liberia
Russians
$38,165
PER CAPITA INCOME
0.2/ 100
METRIC RATING
275th/ 347
METRIC RANK
$53,154
PER CAPITA INCOME
100.0/ 100
METRIC RATING
26th/ 347
METRIC RANK
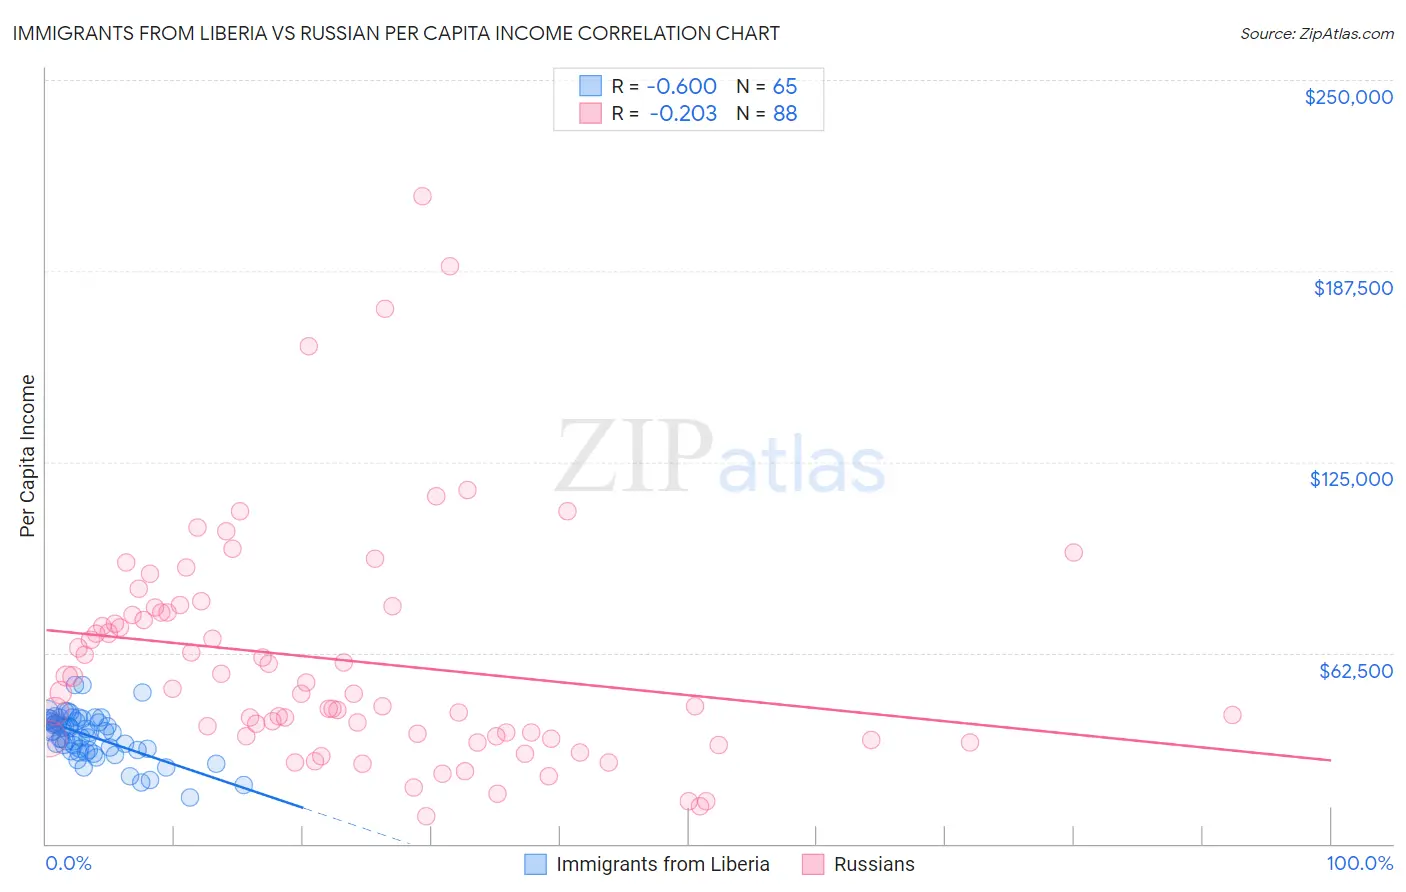
Immigrants from Liberia vs Russian Per Capita Income Correlation Chart
The statistical analysis conducted on geographies consisting of 135,297,410 people shows a substantial negative correlation between the proportion of Immigrants from Liberia and per capita income in the United States with a correlation coefficient (R) of -0.600 and weighted average of $38,165. Similarly, the statistical analysis conducted on geographies consisting of 512,304,099 people shows a weak negative correlation between the proportion of Russians and per capita income in the United States with a correlation coefficient (R) of -0.203 and weighted average of $53,154, a difference of 39.3%.
Per Capita Income Correlation Summary
| Measurement | Immigrants from Liberia | Russian |
| Minimum | $15,041 | $9,193 |
| Maximum | $52,065 | $212,036 |
| Range | $37,024 | $202,843 |
| Mean | $35,319 | $59,937 |
| Median | $36,534 | $49,383 |
| Interquartile 25% (IQ1) | $30,654 | $34,688 |
| Interquartile 75% (IQ3) | $40,514 | $75,613 |
| Interquartile Range (IQR) | $9,860 | $40,926 |
| Standard Deviation (Sample) | $7,386 | $37,845 |
| Standard Deviation (Population) | $7,329 | $37,630 |
Similar Demographics by Per Capita Income
Demographics Similar to Immigrants from Liberia by Per Capita Income
In terms of per capita income, the demographic groups most similar to Immigrants from Liberia are Hmong ($38,120, a difference of 0.12%), Comanche ($38,088, a difference of 0.20%), Immigrants from Nicaragua ($38,065, a difference of 0.26%), Colville ($38,047, a difference of 0.31%), and Potawatomi ($38,046, a difference of 0.31%).
| Demographics | Rating | Rank | Per Capita Income |
| Liberians | 0.4 /100 | #268 | Tragic $38,780 |
| Immigrants | Jamaica | 0.4 /100 | #269 | Tragic $38,766 |
| Immigrants | Belize | 0.3 /100 | #270 | Tragic $38,614 |
| Central Americans | 0.3 /100 | #271 | Tragic $38,560 |
| Immigrants | Cabo Verde | 0.3 /100 | #272 | Tragic $38,540 |
| Nepalese | 0.3 /100 | #273 | Tragic $38,442 |
| Immigrants | El Salvador | 0.3 /100 | #274 | Tragic $38,394 |
| Immigrants | Liberia | 0.2 /100 | #275 | Tragic $38,165 |
| Hmong | 0.2 /100 | #276 | Tragic $38,120 |
| Comanche | 0.2 /100 | #277 | Tragic $38,088 |
| Immigrants | Nicaragua | 0.2 /100 | #278 | Tragic $38,065 |
| Colville | 0.2 /100 | #279 | Tragic $38,047 |
| Potawatomi | 0.2 /100 | #280 | Tragic $38,046 |
| Immigrants | Dominica | 0.2 /100 | #281 | Tragic $37,952 |
| Immigrants | Laos | 0.1 /100 | #282 | Tragic $37,857 |
Demographics Similar to Russians by Per Capita Income
In terms of per capita income, the demographic groups most similar to Russians are Immigrants from Japan ($53,359, a difference of 0.39%), Immigrants from South Central Asia ($52,660, a difference of 0.94%), Latvian ($52,649, a difference of 0.96%), Israeli ($52,596, a difference of 1.1%), and Immigrants from Denmark ($53,799, a difference of 1.2%).
| Demographics | Rating | Rank | Per Capita Income |
| Immigrants | China | 100.0 /100 | #19 | Exceptional $54,264 |
| Soviet Union | 100.0 /100 | #20 | Exceptional $54,202 |
| Immigrants | Northern Europe | 100.0 /100 | #21 | Exceptional $54,159 |
| Indians (Asian) | 100.0 /100 | #22 | Exceptional $53,874 |
| Immigrants | Eastern Asia | 100.0 /100 | #23 | Exceptional $53,806 |
| Immigrants | Denmark | 100.0 /100 | #24 | Exceptional $53,799 |
| Immigrants | Japan | 100.0 /100 | #25 | Exceptional $53,359 |
| Russians | 100.0 /100 | #26 | Exceptional $53,154 |
| Immigrants | South Central Asia | 100.0 /100 | #27 | Exceptional $52,660 |
| Latvians | 100.0 /100 | #28 | Exceptional $52,649 |
| Israelis | 100.0 /100 | #29 | Exceptional $52,596 |
| Immigrants | Austria | 100.0 /100 | #30 | Exceptional $52,503 |
| Turks | 100.0 /100 | #31 | Exceptional $52,391 |
| Immigrants | Norway | 100.0 /100 | #32 | Exceptional $52,217 |
| Australians | 100.0 /100 | #33 | Exceptional $52,074 |