Immigrants from Czechoslovakia vs Russian Per Capita Income
COMPARE
Immigrants from Czechoslovakia
Russian
Per Capita Income
Per Capita Income Comparison
Immigrants from Czechoslovakia
Russians
$51,770
PER CAPITA INCOME
100.0/ 100
METRIC RATING
38th/ 347
METRIC RANK
$53,154
PER CAPITA INCOME
100.0/ 100
METRIC RATING
26th/ 347
METRIC RANK
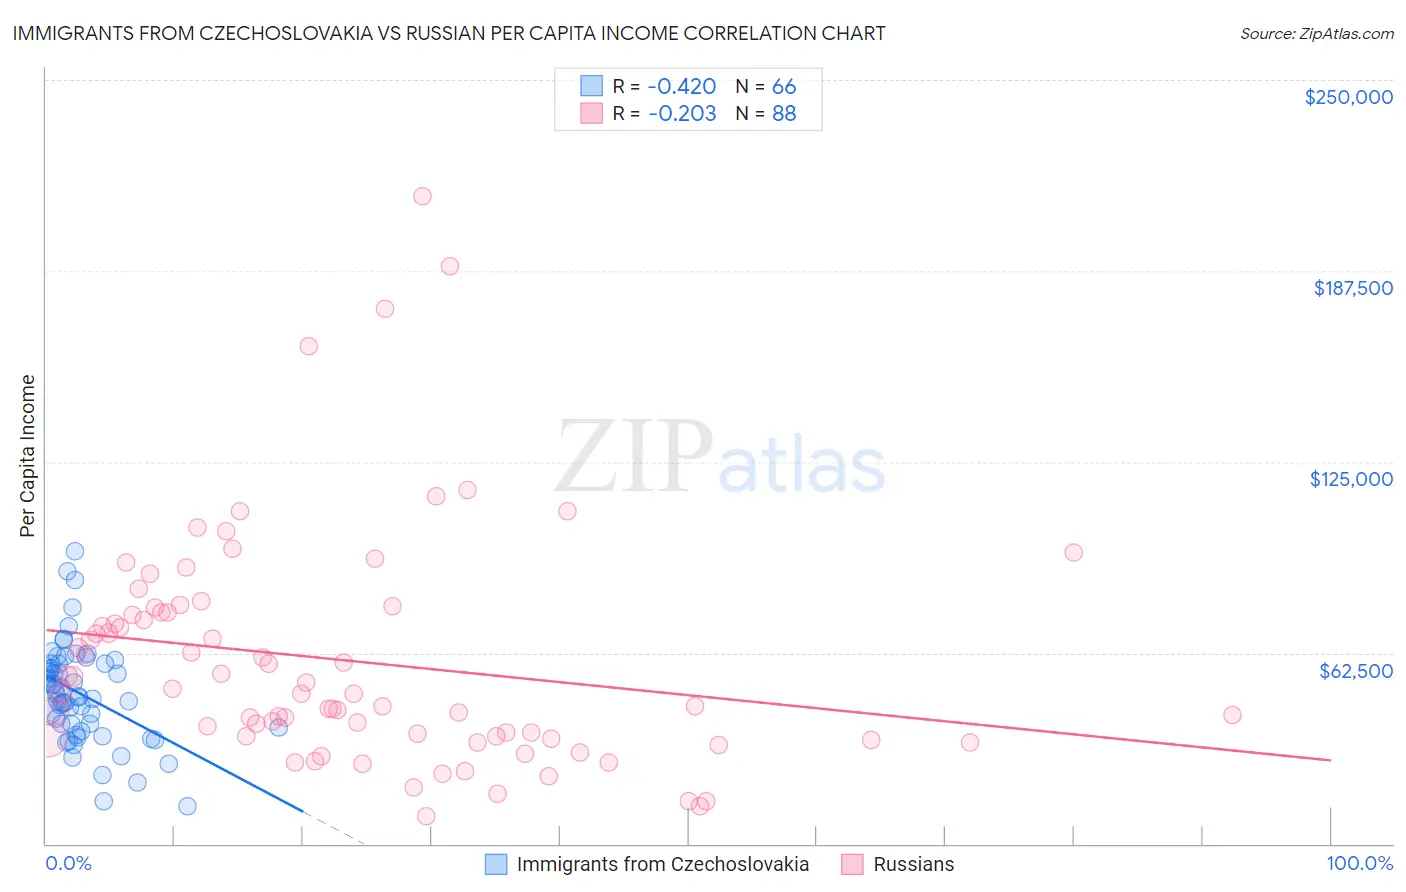
Immigrants from Czechoslovakia vs Russian Per Capita Income Correlation Chart
The statistical analysis conducted on geographies consisting of 195,456,516 people shows a moderate negative correlation between the proportion of Immigrants from Czechoslovakia and per capita income in the United States with a correlation coefficient (R) of -0.420 and weighted average of $51,770. Similarly, the statistical analysis conducted on geographies consisting of 512,304,099 people shows a weak negative correlation between the proportion of Russians and per capita income in the United States with a correlation coefficient (R) of -0.203 and weighted average of $53,154, a difference of 2.7%.
Per Capita Income Correlation Summary
| Measurement | Immigrants from Czechoslovakia | Russian |
| Minimum | $12,340 | $9,193 |
| Maximum | $95,878 | $212,036 |
| Range | $83,538 | $202,843 |
| Mean | $48,860 | $59,937 |
| Median | $48,155 | $49,383 |
| Interquartile 25% (IQ1) | $37,887 | $34,688 |
| Interquartile 75% (IQ3) | $58,814 | $75,613 |
| Interquartile Range (IQR) | $20,927 | $40,926 |
| Standard Deviation (Sample) | $16,197 | $37,845 |
| Standard Deviation (Population) | $16,074 | $37,630 |
Demographics Similar to Immigrants from Czechoslovakia and Russians by Per Capita Income
In terms of per capita income, the demographic groups most similar to Immigrants from Czechoslovakia are Cambodian ($51,731, a difference of 0.070%), Immigrants from Korea ($51,671, a difference of 0.19%), Estonian ($51,875, a difference of 0.20%), Immigrants from Greece ($51,891, a difference of 0.23%), and Burmese ($52,005, a difference of 0.45%). Similarly, the demographic groups most similar to Russians are Immigrants from Japan ($53,359, a difference of 0.39%), Immigrants from South Central Asia ($52,660, a difference of 0.94%), Latvian ($52,649, a difference of 0.96%), Israeli ($52,596, a difference of 1.1%), and Immigrants from Denmark ($53,799, a difference of 1.2%).
| Demographics | Rating | Rank | Per Capita Income |
| Indians (Asian) | 100.0 /100 | #22 | Exceptional $53,874 |
| Immigrants | Eastern Asia | 100.0 /100 | #23 | Exceptional $53,806 |
| Immigrants | Denmark | 100.0 /100 | #24 | Exceptional $53,799 |
| Immigrants | Japan | 100.0 /100 | #25 | Exceptional $53,359 |
| Russians | 100.0 /100 | #26 | Exceptional $53,154 |
| Immigrants | South Central Asia | 100.0 /100 | #27 | Exceptional $52,660 |
| Latvians | 100.0 /100 | #28 | Exceptional $52,649 |
| Israelis | 100.0 /100 | #29 | Exceptional $52,596 |
| Immigrants | Austria | 100.0 /100 | #30 | Exceptional $52,503 |
| Turks | 100.0 /100 | #31 | Exceptional $52,391 |
| Immigrants | Norway | 100.0 /100 | #32 | Exceptional $52,217 |
| Australians | 100.0 /100 | #33 | Exceptional $52,074 |
| Immigrants | Russia | 100.0 /100 | #34 | Exceptional $52,044 |
| Burmese | 100.0 /100 | #35 | Exceptional $52,005 |
| Immigrants | Greece | 100.0 /100 | #36 | Exceptional $51,891 |
| Estonians | 100.0 /100 | #37 | Exceptional $51,875 |
| Immigrants | Czechoslovakia | 100.0 /100 | #38 | Exceptional $51,770 |
| Cambodians | 100.0 /100 | #39 | Exceptional $51,731 |
| Immigrants | Korea | 100.0 /100 | #40 | Exceptional $51,671 |
| Immigrants | South Africa | 100.0 /100 | #41 | Exceptional $51,465 |
| Immigrants | Turkey | 100.0 /100 | #42 | Exceptional $51,368 |