Greek vs Immigrants from Netherlands Per Capita Income
COMPARE
Greek
Immigrants from Netherlands
Per Capita Income
Per Capita Income Comparison
Greeks
Immigrants from Netherlands
$49,309
PER CAPITA INCOME
99.8/ 100
METRIC RATING
71st/ 347
METRIC RANK
$50,458
PER CAPITA INCOME
100.0/ 100
METRIC RATING
51st/ 347
METRIC RANK
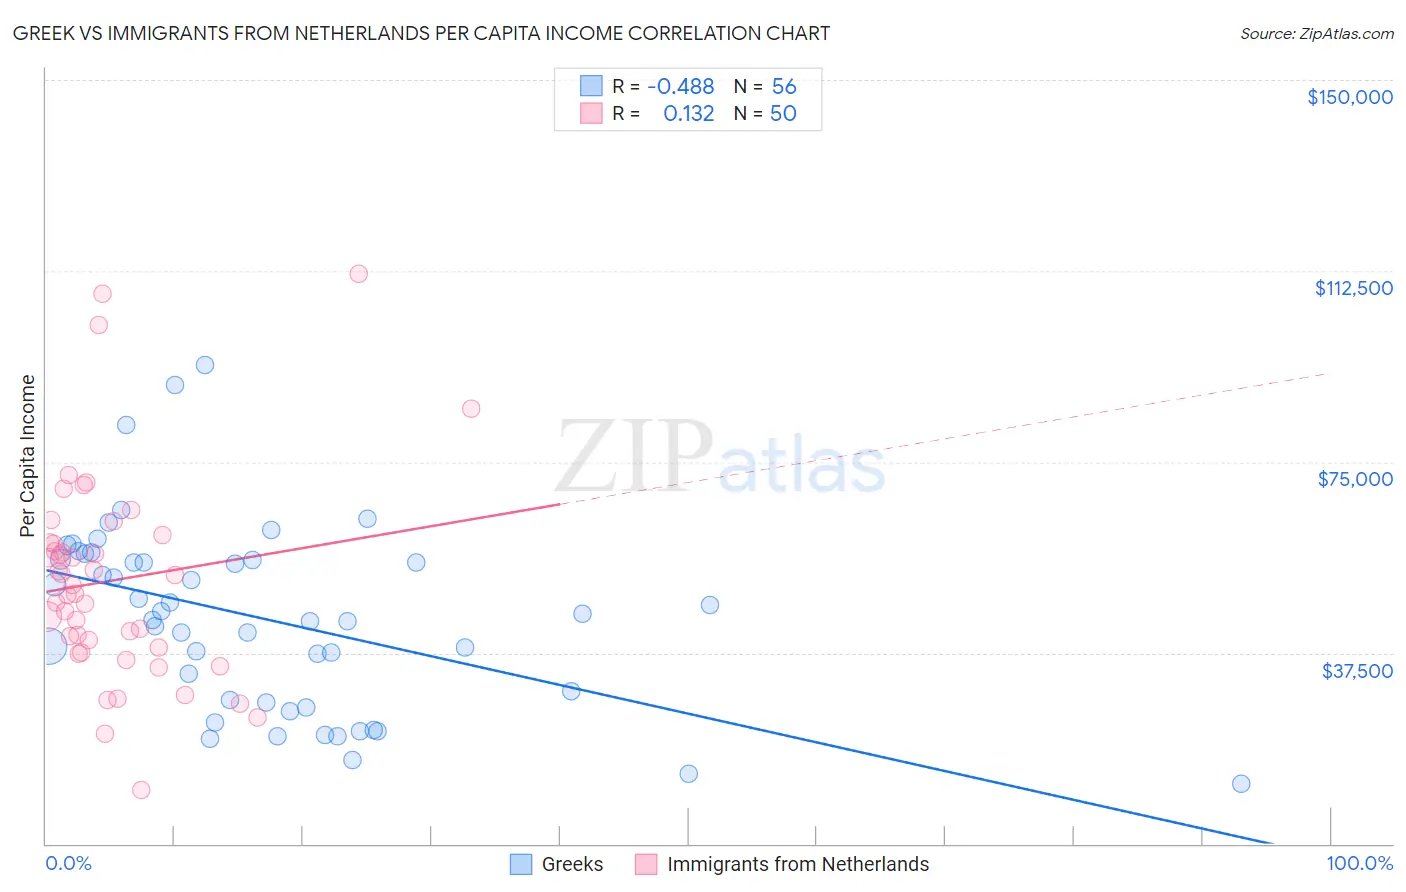
Greek vs Immigrants from Netherlands Per Capita Income Correlation Chart
The statistical analysis conducted on geographies consisting of 482,808,471 people shows a moderate negative correlation between the proportion of Greeks and per capita income in the United States with a correlation coefficient (R) of -0.488 and weighted average of $49,309. Similarly, the statistical analysis conducted on geographies consisting of 237,881,407 people shows a poor positive correlation between the proportion of Immigrants from Netherlands and per capita income in the United States with a correlation coefficient (R) of 0.132 and weighted average of $50,458, a difference of 2.3%.
Per Capita Income Correlation Summary
| Measurement | Greek | Immigrants from Netherlands |
| Minimum | $11,668 | $10,464 |
| Maximum | $93,958 | $111,976 |
| Range | $82,290 | $101,512 |
| Mean | $44,253 | $51,773 |
| Median | $44,552 | $49,974 |
| Interquartile 25% (IQ1) | $28,035 | $38,654 |
| Interquartile 75% (IQ3) | $55,859 | $59,110 |
| Interquartile Range (IQR) | $27,823 | $20,456 |
| Standard Deviation (Sample) | $18,189 | $20,417 |
| Standard Deviation (Population) | $18,026 | $20,212 |
Demographics Similar to Greeks and Immigrants from Netherlands by Per Capita Income
In terms of per capita income, the demographic groups most similar to Greeks are Immigrants from Eastern Europe ($49,316, a difference of 0.010%), Immigrants from Canada ($49,412, a difference of 0.21%), Lithuanian ($49,448, a difference of 0.28%), Immigrants from Romania ($49,463, a difference of 0.31%), and Immigrants from Bulgaria ($49,482, a difference of 0.35%). Similarly, the demographic groups most similar to Immigrants from Netherlands are Immigrants from Croatia ($50,417, a difference of 0.080%), Paraguayan ($50,385, a difference of 0.14%), Immigrants from Belarus ($50,303, a difference of 0.31%), Immigrants from Western Europe ($50,065, a difference of 0.78%), and Asian ($50,057, a difference of 0.80%).
| Demographics | Rating | Rank | Per Capita Income |
| Immigrants | Netherlands | 100.0 /100 | #51 | Exceptional $50,458 |
| Immigrants | Croatia | 99.9 /100 | #52 | Exceptional $50,417 |
| Paraguayans | 99.9 /100 | #53 | Exceptional $50,385 |
| Immigrants | Belarus | 99.9 /100 | #54 | Exceptional $50,303 |
| Immigrants | Western Europe | 99.9 /100 | #55 | Exceptional $50,065 |
| Asians | 99.9 /100 | #56 | Exceptional $50,057 |
| South Africans | 99.9 /100 | #57 | Exceptional $50,044 |
| Immigrants | Malaysia | 99.9 /100 | #58 | Exceptional $49,983 |
| Bhutanese | 99.9 /100 | #59 | Exceptional $49,894 |
| Immigrants | Scotland | 99.9 /100 | #60 | Exceptional $49,893 |
| Argentineans | 99.9 /100 | #61 | Exceptional $49,862 |
| Immigrants | Asia | 99.9 /100 | #62 | Exceptional $49,741 |
| Maltese | 99.9 /100 | #63 | Exceptional $49,640 |
| Immigrants | Argentina | 99.9 /100 | #64 | Exceptional $49,627 |
| Bolivians | 99.9 /100 | #65 | Exceptional $49,526 |
| Immigrants | Bulgaria | 99.9 /100 | #66 | Exceptional $49,482 |
| Immigrants | Romania | 99.9 /100 | #67 | Exceptional $49,463 |
| Lithuanians | 99.8 /100 | #68 | Exceptional $49,448 |
| Immigrants | Canada | 99.8 /100 | #69 | Exceptional $49,412 |
| Immigrants | Eastern Europe | 99.8 /100 | #70 | Exceptional $49,316 |
| Greeks | 99.8 /100 | #71 | Exceptional $49,309 |