Spanish vs Immigrants from Netherlands Per Capita Income
COMPARE
Spanish
Immigrants from Netherlands
Per Capita Income
Per Capita Income Comparison
Spanish
Immigrants from Netherlands
$42,249
PER CAPITA INCOME
17.0/ 100
METRIC RATING
203rd/ 347
METRIC RANK
$50,458
PER CAPITA INCOME
100.0/ 100
METRIC RATING
51st/ 347
METRIC RANK
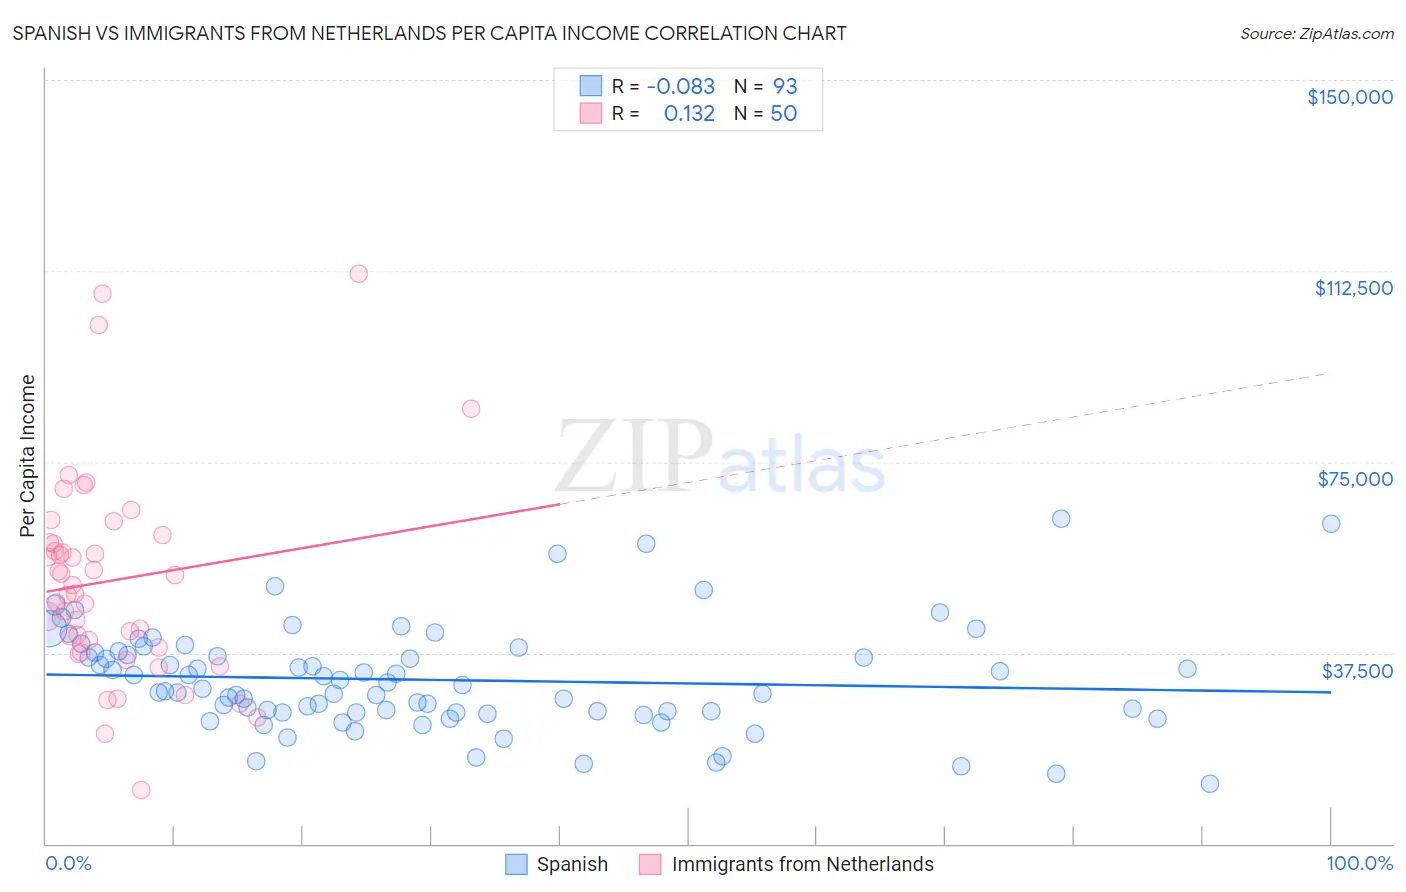
Spanish vs Immigrants from Netherlands Per Capita Income Correlation Chart
The statistical analysis conducted on geographies consisting of 422,211,321 people shows a slight negative correlation between the proportion of Spanish and per capita income in the United States with a correlation coefficient (R) of -0.083 and weighted average of $42,249. Similarly, the statistical analysis conducted on geographies consisting of 237,881,407 people shows a poor positive correlation between the proportion of Immigrants from Netherlands and per capita income in the United States with a correlation coefficient (R) of 0.132 and weighted average of $50,458, a difference of 19.4%.
Per Capita Income Correlation Summary
| Measurement | Spanish | Immigrants from Netherlands |
| Minimum | $11,849 | $10,464 |
| Maximum | $63,855 | $111,976 |
| Range | $52,006 | $101,512 |
| Mean | $32,202 | $51,773 |
| Median | $30,353 | $49,974 |
| Interquartile 25% (IQ1) | $25,756 | $38,654 |
| Interquartile 75% (IQ3) | $37,741 | $59,110 |
| Interquartile Range (IQR) | $11,984 | $20,456 |
| Standard Deviation (Sample) | $10,280 | $20,417 |
| Standard Deviation (Population) | $10,225 | $20,212 |
Similar Demographics by Per Capita Income
Demographics Similar to Spanish by Per Capita Income
In terms of per capita income, the demographic groups most similar to Spanish are Immigrants from Bosnia and Herzegovina ($42,278, a difference of 0.070%), Immigrants from Thailand ($42,289, a difference of 0.090%), Aleut ($42,210, a difference of 0.090%), White/Caucasian ($42,180, a difference of 0.16%), and Ghanaian ($42,164, a difference of 0.20%).
| Demographics | Rating | Rank | Per Capita Income |
| Dutch | 23.4 /100 | #196 | Fair $42,605 |
| Scotch-Irish | 22.6 /100 | #197 | Fair $42,563 |
| Immigrants | Portugal | 19.7 /100 | #198 | Poor $42,412 |
| Barbadians | 19.6 /100 | #199 | Poor $42,406 |
| Vietnamese | 19.0 /100 | #200 | Poor $42,368 |
| Immigrants | Thailand | 17.6 /100 | #201 | Poor $42,289 |
| Immigrants | Bosnia and Herzegovina | 17.5 /100 | #202 | Poor $42,278 |
| Spanish | 17.0 /100 | #203 | Poor $42,249 |
| Aleuts | 16.4 /100 | #204 | Poor $42,210 |
| Whites/Caucasians | 15.9 /100 | #205 | Poor $42,180 |
| Ghanaians | 15.7 /100 | #206 | Poor $42,164 |
| Venezuelans | 14.4 /100 | #207 | Poor $42,074 |
| Panamanians | 13.9 /100 | #208 | Poor $42,035 |
| Immigrants | Sudan | 13.2 /100 | #209 | Poor $41,986 |
| Ecuadorians | 12.9 /100 | #210 | Poor $41,958 |
Demographics Similar to Immigrants from Netherlands by Per Capita Income
In terms of per capita income, the demographic groups most similar to Immigrants from Netherlands are Immigrants from Croatia ($50,417, a difference of 0.080%), Paraguayan ($50,385, a difference of 0.14%), Immigrants from Sri Lanka ($50,555, a difference of 0.19%), New Zealander ($50,575, a difference of 0.23%), and Immigrants from Belarus ($50,303, a difference of 0.31%).
| Demographics | Rating | Rank | Per Capita Income |
| Immigrants | Europe | 100.0 /100 | #44 | Exceptional $50,950 |
| Immigrants | Spain | 100.0 /100 | #45 | Exceptional $50,933 |
| Immigrants | Latvia | 100.0 /100 | #46 | Exceptional $50,914 |
| Bulgarians | 100.0 /100 | #47 | Exceptional $50,906 |
| Immigrants | Serbia | 100.0 /100 | #48 | Exceptional $50,810 |
| New Zealanders | 100.0 /100 | #49 | Exceptional $50,575 |
| Immigrants | Sri Lanka | 100.0 /100 | #50 | Exceptional $50,555 |
| Immigrants | Netherlands | 100.0 /100 | #51 | Exceptional $50,458 |
| Immigrants | Croatia | 99.9 /100 | #52 | Exceptional $50,417 |
| Paraguayans | 99.9 /100 | #53 | Exceptional $50,385 |
| Immigrants | Belarus | 99.9 /100 | #54 | Exceptional $50,303 |
| Immigrants | Western Europe | 99.9 /100 | #55 | Exceptional $50,065 |
| Asians | 99.9 /100 | #56 | Exceptional $50,057 |
| South Africans | 99.9 /100 | #57 | Exceptional $50,044 |
| Immigrants | Malaysia | 99.9 /100 | #58 | Exceptional $49,983 |