Osage vs Immigrants from Lithuania Divorced or Separated
COMPARE
Osage
Immigrants from Lithuania
Divorced or Separated
Divorced or Separated Comparison
Osage
Immigrants from Lithuania
13.4%
DIVORCED OR SEPARATED
0.0/ 100
METRIC RATING
324th/ 347
METRIC RANK
11.3%
DIVORCED OR SEPARATED
99.9/ 100
METRIC RATING
53rd/ 347
METRIC RANK
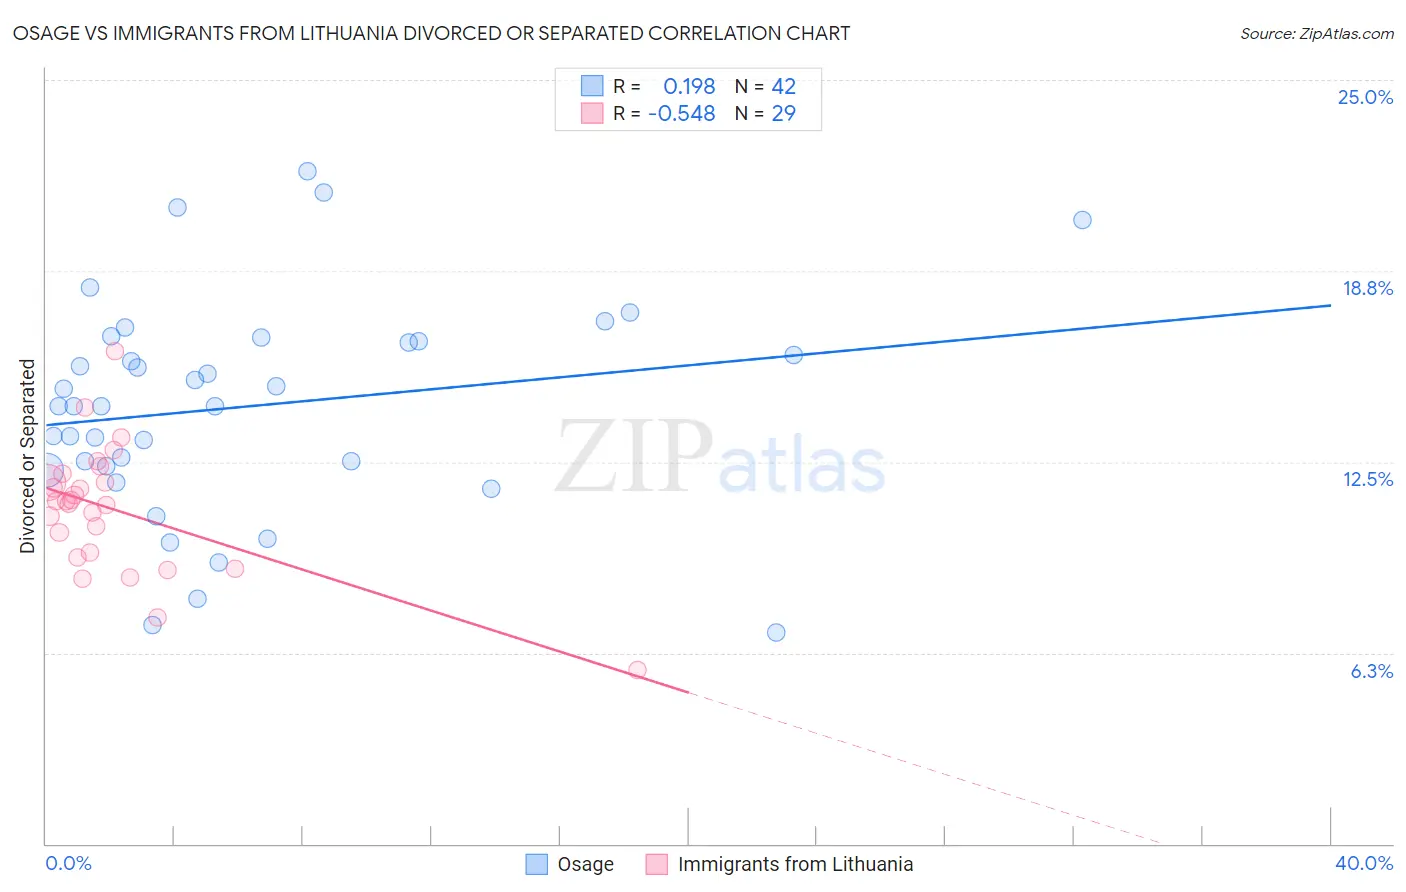
Osage vs Immigrants from Lithuania Divorced or Separated Correlation Chart
The statistical analysis conducted on geographies consisting of 91,805,923 people shows a poor positive correlation between the proportion of Osage and percentage of population currently divorced or separated in the United States with a correlation coefficient (R) of 0.198 and weighted average of 13.4%. Similarly, the statistical analysis conducted on geographies consisting of 117,722,237 people shows a substantial negative correlation between the proportion of Immigrants from Lithuania and percentage of population currently divorced or separated in the United States with a correlation coefficient (R) of -0.548 and weighted average of 11.3%, a difference of 19.1%.
Divorced or Separated Correlation Summary
| Measurement | Osage | Immigrants from Lithuania |
| Minimum | 6.9% | 5.7% |
| Maximum | 22.0% | 16.1% |
| Range | 15.1% | 10.4% |
| Mean | 14.3% | 10.9% |
| Median | 14.3% | 11.2% |
| Interquartile 25% (IQ1) | 12.3% | 9.5% |
| Interquartile 75% (IQ3) | 16.5% | 12.0% |
| Interquartile Range (IQR) | 4.1% | 2.5% |
| Standard Deviation (Sample) | 3.5% | 2.1% |
| Standard Deviation (Population) | 3.5% | 2.0% |
Similar Demographics by Divorced or Separated
Demographics Similar to Osage by Divorced or Separated
In terms of divorced or separated, the demographic groups most similar to Osage are Potawatomi (13.5%, a difference of 0.060%), U.S. Virgin Islander (13.4%, a difference of 0.070%), Immigrants from Congo (13.5%, a difference of 0.070%), Immigrants from Haiti (13.4%, a difference of 0.29%), and Cheyenne (13.4%, a difference of 0.53%).
| Demographics | Rating | Rank | Divorced or Separated |
| Haitians | 0.0 /100 | #317 | Tragic 13.3% |
| Cree | 0.0 /100 | #318 | Tragic 13.4% |
| Puget Sound Salish | 0.0 /100 | #319 | Tragic 13.4% |
| Cajuns | 0.0 /100 | #320 | Tragic 13.4% |
| Cheyenne | 0.0 /100 | #321 | Tragic 13.4% |
| Immigrants | Haiti | 0.0 /100 | #322 | Tragic 13.4% |
| U.S. Virgin Islanders | 0.0 /100 | #323 | Tragic 13.4% |
| Osage | 0.0 /100 | #324 | Tragic 13.4% |
| Potawatomi | 0.0 /100 | #325 | Tragic 13.5% |
| Immigrants | Congo | 0.0 /100 | #326 | Tragic 13.5% |
| Comanche | 0.0 /100 | #327 | Tragic 13.5% |
| Immigrants | Caribbean | 0.0 /100 | #328 | Tragic 13.6% |
| Houma | 0.0 /100 | #329 | Tragic 13.6% |
| Paiute | 0.0 /100 | #330 | Tragic 13.6% |
| Blacks/African Americans | 0.0 /100 | #331 | Tragic 13.6% |
Demographics Similar to Immigrants from Lithuania by Divorced or Separated
In terms of divorced or separated, the demographic groups most similar to Immigrants from Lithuania are Eastern European (11.3%, a difference of 0.11%), Immigrants from Yemen (11.3%, a difference of 0.12%), Immigrants from Philippines (11.3%, a difference of 0.19%), Immigrants from Vietnam (11.3%, a difference of 0.19%), and Immigrants from Australia (11.3%, a difference of 0.23%).
| Demographics | Rating | Rank | Divorced or Separated |
| Laotians | 100.0 /100 | #46 | Exceptional 11.2% |
| Immigrants | Poland | 100.0 /100 | #47 | Exceptional 11.2% |
| Immigrants | Turkey | 100.0 /100 | #48 | Exceptional 11.2% |
| Immigrants | Saudi Arabia | 100.0 /100 | #49 | Exceptional 11.2% |
| Bolivians | 100.0 /100 | #50 | Exceptional 11.2% |
| Immigrants | Bolivia | 100.0 /100 | #51 | Exceptional 11.3% |
| Immigrants | Australia | 99.9 /100 | #52 | Exceptional 11.3% |
| Immigrants | Lithuania | 99.9 /100 | #53 | Exceptional 11.3% |
| Eastern Europeans | 99.9 /100 | #54 | Exceptional 11.3% |
| Immigrants | Yemen | 99.9 /100 | #55 | Exceptional 11.3% |
| Immigrants | Philippines | 99.9 /100 | #56 | Exceptional 11.3% |
| Immigrants | Vietnam | 99.9 /100 | #57 | Exceptional 11.3% |
| Sri Lankans | 99.9 /100 | #58 | Exceptional 11.3% |
| Israelis | 99.9 /100 | #59 | Exceptional 11.3% |
| Immigrants | Russia | 99.9 /100 | #60 | Exceptional 11.3% |