Osage vs Immigrants from Lithuania Male Unemployment
COMPARE
Osage
Immigrants from Lithuania
Male Unemployment
Male Unemployment Comparison
Osage
Immigrants from Lithuania
5.3%
MALE UNEMPLOYMENT
42.5/ 100
METRIC RATING
178th/ 347
METRIC RANK
5.1%
MALE UNEMPLOYMENT
87.2/ 100
METRIC RATING
125th/ 347
METRIC RANK
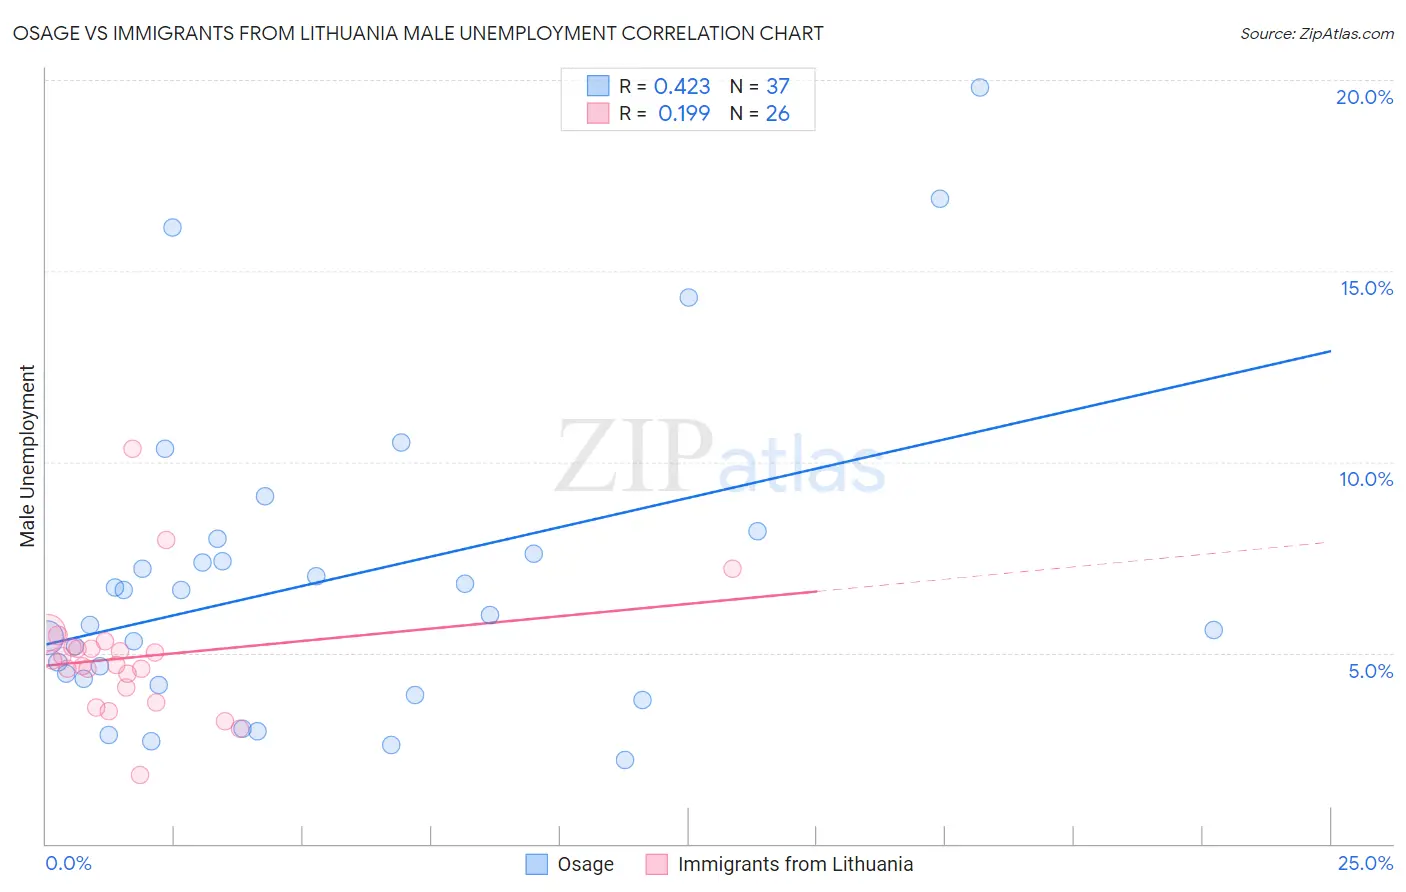
Osage vs Immigrants from Lithuania Male Unemployment Correlation Chart
The statistical analysis conducted on geographies consisting of 91,677,196 people shows a moderate positive correlation between the proportion of Osage and unemployment rate among males in the United States with a correlation coefficient (R) of 0.423 and weighted average of 5.3%. Similarly, the statistical analysis conducted on geographies consisting of 117,611,759 people shows a poor positive correlation between the proportion of Immigrants from Lithuania and unemployment rate among males in the United States with a correlation coefficient (R) of 0.199 and weighted average of 5.1%, a difference of 3.3%.
Male Unemployment Correlation Summary
| Measurement | Osage | Immigrants from Lithuania |
| Minimum | 2.2% | 1.8% |
| Maximum | 19.8% | 10.4% |
| Range | 17.6% | 8.5% |
| Mean | 6.9% | 4.9% |
| Median | 6.0% | 4.7% |
| Interquartile 25% (IQ1) | 4.2% | 4.1% |
| Interquartile 75% (IQ3) | 7.8% | 5.1% |
| Interquartile Range (IQR) | 3.6% | 1.1% |
| Standard Deviation (Sample) | 4.1% | 1.6% |
| Standard Deviation (Population) | 4.0% | 1.6% |
Similar Demographics by Male Unemployment
Demographics Similar to Osage by Male Unemployment
In terms of male unemployment, the demographic groups most similar to Osage are Immigrants from Oceania (5.3%, a difference of 0.10%), Immigrants from Peru (5.3%, a difference of 0.13%), Malaysian (5.3%, a difference of 0.17%), Immigrants from Poland (5.3%, a difference of 0.21%), and Immigrants from Afghanistan (5.3%, a difference of 0.28%).
| Demographics | Rating | Rank | Male Unemployment |
| Peruvians | 51.9 /100 | #171 | Average 5.3% |
| Immigrants | Kazakhstan | 50.8 /100 | #172 | Average 5.3% |
| Immigrants | Russia | 50.7 /100 | #173 | Average 5.3% |
| Immigrants | Iran | 50.0 /100 | #174 | Average 5.3% |
| Immigrants | Iraq | 48.1 /100 | #175 | Average 5.3% |
| Immigrants | Poland | 46.0 /100 | #176 | Average 5.3% |
| Immigrants | Peru | 44.6 /100 | #177 | Average 5.3% |
| Osage | 42.5 /100 | #178 | Average 5.3% |
| Immigrants | Oceania | 40.8 /100 | #179 | Average 5.3% |
| Malaysians | 39.6 /100 | #180 | Fair 5.3% |
| Immigrants | Afghanistan | 37.9 /100 | #181 | Fair 5.3% |
| Potawatomi | 37.8 /100 | #182 | Fair 5.3% |
| Taiwanese | 37.6 /100 | #183 | Fair 5.3% |
| Spaniards | 35.1 /100 | #184 | Fair 5.3% |
| Koreans | 34.9 /100 | #185 | Fair 5.3% |
Demographics Similar to Immigrants from Lithuania by Male Unemployment
In terms of male unemployment, the demographic groups most similar to Immigrants from Lithuania are Immigrants from Latvia (5.1%, a difference of 0.040%), Immigrants from Colombia (5.1%, a difference of 0.060%), Palestinian (5.1%, a difference of 0.070%), Immigrants from Brazil (5.2%, a difference of 0.11%), and Nicaraguan (5.1%, a difference of 0.14%).
| Demographics | Rating | Rank | Male Unemployment |
| Cypriots | 88.8 /100 | #118 | Excellent 5.1% |
| French Canadians | 88.6 /100 | #119 | Excellent 5.1% |
| Ukrainians | 88.4 /100 | #120 | Excellent 5.1% |
| Mongolians | 88.4 /100 | #121 | Excellent 5.1% |
| Nicaraguans | 88.2 /100 | #122 | Excellent 5.1% |
| Palestinians | 87.7 /100 | #123 | Excellent 5.1% |
| Immigrants | Latvia | 87.5 /100 | #124 | Excellent 5.1% |
| Immigrants | Lithuania | 87.2 /100 | #125 | Excellent 5.1% |
| Immigrants | Colombia | 86.8 /100 | #126 | Excellent 5.1% |
| Immigrants | Brazil | 86.3 /100 | #127 | Excellent 5.2% |
| Hungarians | 85.1 /100 | #128 | Excellent 5.2% |
| Immigrants | Western Europe | 84.8 /100 | #129 | Excellent 5.2% |
| Immigrants | Malaysia | 83.5 /100 | #130 | Excellent 5.2% |
| Immigrants | Germany | 83.0 /100 | #131 | Excellent 5.2% |
| Chickasaw | 82.9 /100 | #132 | Excellent 5.2% |