Osage vs Belizean Median Family Income
COMPARE
Osage
Belizean
Median Family Income
Median Family Income Comparison
Osage
Belizeans
$91,926
MEDIAN FAMILY INCOME
0.4/ 100
METRIC RATING
258th/ 347
METRIC RANK
$90,880
MEDIAN FAMILY INCOME
0.2/ 100
METRIC RATING
269th/ 347
METRIC RANK
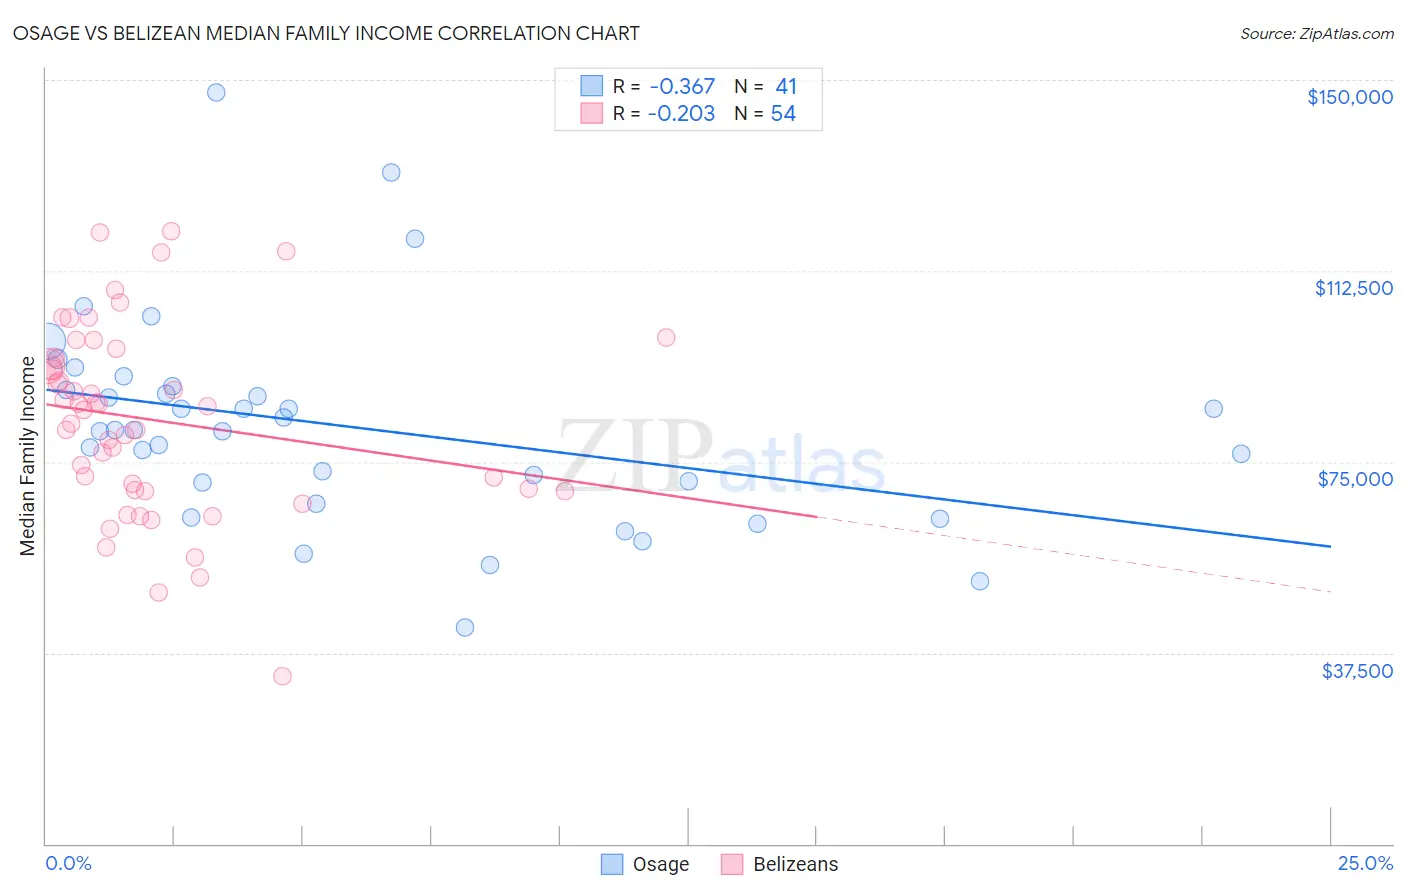
Osage vs Belizean Median Family Income Correlation Chart
The statistical analysis conducted on geographies consisting of 91,794,477 people shows a mild negative correlation between the proportion of Osage and median family income in the United States with a correlation coefficient (R) of -0.367 and weighted average of $91,926. Similarly, the statistical analysis conducted on geographies consisting of 144,140,604 people shows a weak negative correlation between the proportion of Belizeans and median family income in the United States with a correlation coefficient (R) of -0.203 and weighted average of $90,880, a difference of 1.1%.
Median Family Income Correlation Summary
| Measurement | Osage | Belizean |
| Minimum | $42,500 | $32,813 |
| Maximum | $147,522 | $120,348 |
| Range | $105,022 | $87,535 |
| Mean | $81,978 | $83,217 |
| Median | $81,165 | $85,583 |
| Interquartile 25% (IQ1) | $68,927 | $69,412 |
| Interquartile 75% (IQ3) | $89,553 | $95,563 |
| Interquartile Range (IQR) | $20,626 | $26,151 |
| Standard Deviation (Sample) | $20,387 | $18,683 |
| Standard Deviation (Population) | $20,137 | $18,509 |
Demographics Similar to Osage and Belizeans by Median Family Income
In terms of median family income, the demographic groups most similar to Osage are Cape Verdean ($91,848, a difference of 0.090%), Pennsylvania German ($91,763, a difference of 0.18%), American ($92,096, a difference of 0.19%), Inupiat ($91,730, a difference of 0.21%), and Liberian ($91,722, a difference of 0.22%). Similarly, the demographic groups most similar to Belizeans are Cree ($90,882, a difference of 0.0%), Mexican American Indian ($90,918, a difference of 0.040%), Central American ($91,087, a difference of 0.23%), Jamaican ($90,581, a difference of 0.33%), and Iroquois ($90,543, a difference of 0.37%).
| Demographics | Rating | Rank | Median Family Income |
| Immigrants | Guyana | 0.6 /100 | #253 | Tragic $92,513 |
| Immigrants | Barbados | 0.5 /100 | #254 | Tragic $92,419 |
| Immigrants | Laos | 0.5 /100 | #255 | Tragic $92,239 |
| Nicaraguans | 0.5 /100 | #256 | Tragic $92,231 |
| Americans | 0.4 /100 | #257 | Tragic $92,096 |
| Osage | 0.4 /100 | #258 | Tragic $91,926 |
| Cape Verdeans | 0.4 /100 | #259 | Tragic $91,848 |
| Pennsylvania Germans | 0.4 /100 | #260 | Tragic $91,763 |
| Inupiat | 0.4 /100 | #261 | Tragic $91,730 |
| Liberians | 0.4 /100 | #262 | Tragic $91,722 |
| Immigrants | West Indies | 0.3 /100 | #263 | Tragic $91,588 |
| Senegalese | 0.3 /100 | #264 | Tragic $91,475 |
| Hmong | 0.3 /100 | #265 | Tragic $91,296 |
| Central Americans | 0.3 /100 | #266 | Tragic $91,087 |
| Mexican American Indians | 0.2 /100 | #267 | Tragic $90,918 |
| Cree | 0.2 /100 | #268 | Tragic $90,882 |
| Belizeans | 0.2 /100 | #269 | Tragic $90,880 |
| Jamaicans | 0.2 /100 | #270 | Tragic $90,581 |
| Iroquois | 0.2 /100 | #271 | Tragic $90,543 |
| Immigrants | Liberia | 0.2 /100 | #272 | Tragic $90,450 |
| Immigrants | Micronesia | 0.2 /100 | #273 | Tragic $90,345 |