Osage vs Arab Median Family Income
COMPARE
Osage
Arab
Median Family Income
Median Family Income Comparison
Osage
Arabs
$91,926
MEDIAN FAMILY INCOME
0.4/ 100
METRIC RATING
258th/ 347
METRIC RANK
$106,952
MEDIAN FAMILY INCOME
89.9/ 100
METRIC RATING
129th/ 347
METRIC RANK
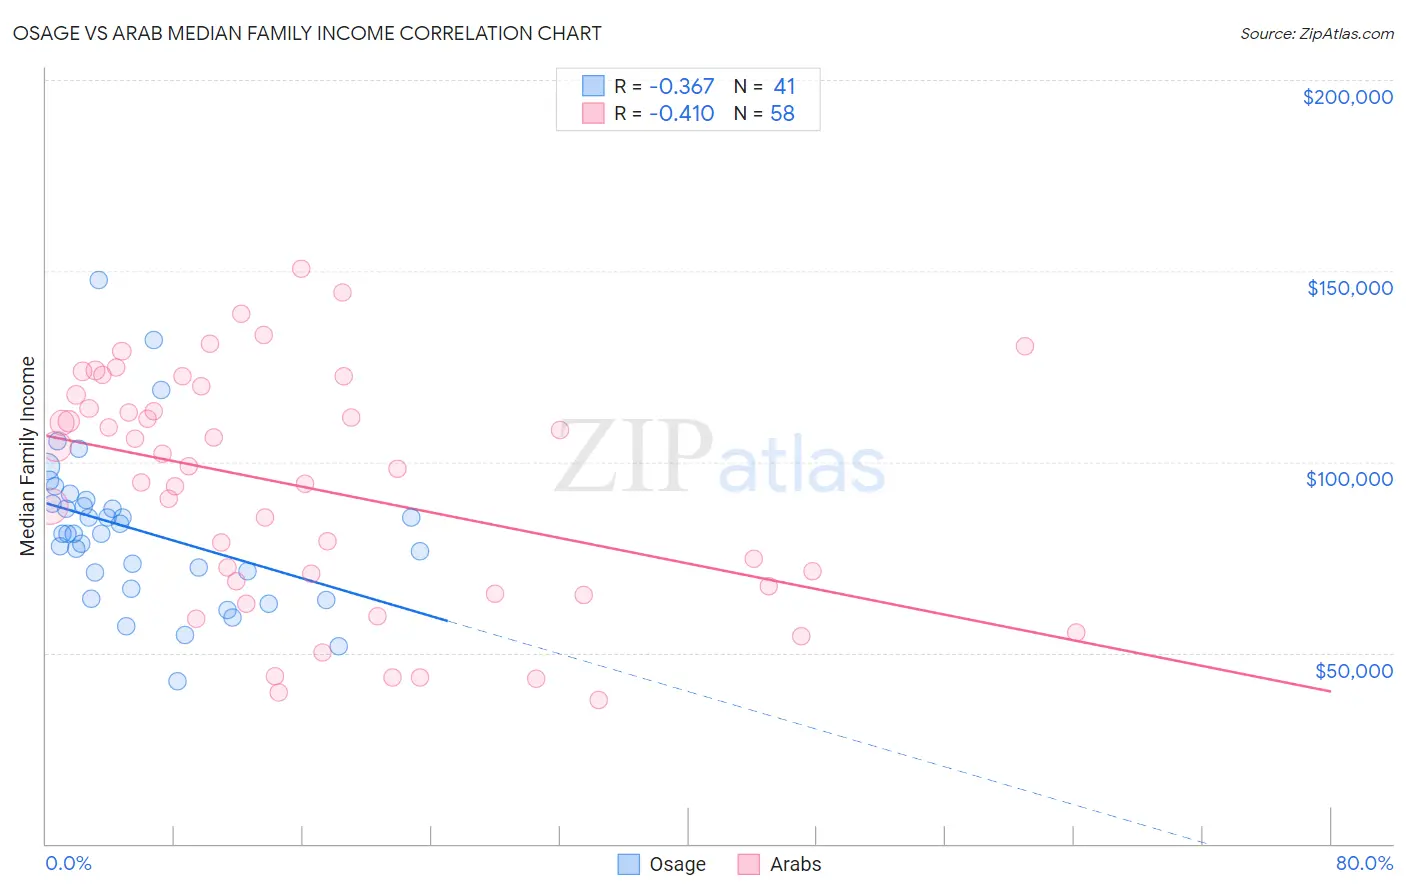
Osage vs Arab Median Family Income Correlation Chart
The statistical analysis conducted on geographies consisting of 91,794,477 people shows a mild negative correlation between the proportion of Osage and median family income in the United States with a correlation coefficient (R) of -0.367 and weighted average of $91,926. Similarly, the statistical analysis conducted on geographies consisting of 486,153,527 people shows a moderate negative correlation between the proportion of Arabs and median family income in the United States with a correlation coefficient (R) of -0.410 and weighted average of $106,952, a difference of 16.4%.
Median Family Income Correlation Summary
| Measurement | Osage | Arab |
| Minimum | $42,500 | $37,540 |
| Maximum | $147,522 | $150,441 |
| Range | $105,022 | $112,901 |
| Mean | $81,978 | $93,185 |
| Median | $81,165 | $98,519 |
| Interquartile 25% (IQ1) | $68,927 | $67,570 |
| Interquartile 75% (IQ3) | $89,553 | $117,614 |
| Interquartile Range (IQR) | $20,626 | $50,044 |
| Standard Deviation (Sample) | $20,387 | $30,451 |
| Standard Deviation (Population) | $20,137 | $30,188 |
Similar Demographics by Median Family Income
Demographics Similar to Osage by Median Family Income
In terms of median family income, the demographic groups most similar to Osage are Cape Verdean ($91,848, a difference of 0.090%), Pennsylvania German ($91,763, a difference of 0.18%), American ($92,096, a difference of 0.19%), Inupiat ($91,730, a difference of 0.21%), and Liberian ($91,722, a difference of 0.22%).
| Demographics | Rating | Rank | Median Family Income |
| Immigrants | Somalia | 0.6 /100 | #251 | Tragic $92,609 |
| Immigrants | El Salvador | 0.6 /100 | #252 | Tragic $92,545 |
| Immigrants | Guyana | 0.6 /100 | #253 | Tragic $92,513 |
| Immigrants | Barbados | 0.5 /100 | #254 | Tragic $92,419 |
| Immigrants | Laos | 0.5 /100 | #255 | Tragic $92,239 |
| Nicaraguans | 0.5 /100 | #256 | Tragic $92,231 |
| Americans | 0.4 /100 | #257 | Tragic $92,096 |
| Osage | 0.4 /100 | #258 | Tragic $91,926 |
| Cape Verdeans | 0.4 /100 | #259 | Tragic $91,848 |
| Pennsylvania Germans | 0.4 /100 | #260 | Tragic $91,763 |
| Inupiat | 0.4 /100 | #261 | Tragic $91,730 |
| Liberians | 0.4 /100 | #262 | Tragic $91,722 |
| Immigrants | West Indies | 0.3 /100 | #263 | Tragic $91,588 |
| Senegalese | 0.3 /100 | #264 | Tragic $91,475 |
| Hmong | 0.3 /100 | #265 | Tragic $91,296 |
Demographics Similar to Arabs by Median Family Income
In terms of median family income, the demographic groups most similar to Arabs are Brazilian ($106,942, a difference of 0.010%), Immigrants from Ethiopia ($106,969, a difference of 0.020%), Lebanese ($107,086, a difference of 0.12%), Serbian ($107,157, a difference of 0.19%), and Taiwanese ($107,295, a difference of 0.32%).
| Demographics | Rating | Rank | Median Family Income |
| Immigrants | Jordan | 92.9 /100 | #122 | Exceptional $107,715 |
| Carpatho Rusyns | 92.2 /100 | #123 | Exceptional $107,502 |
| Pakistanis | 91.7 /100 | #124 | Exceptional $107,390 |
| Taiwanese | 91.4 /100 | #125 | Exceptional $107,295 |
| Serbians | 90.8 /100 | #126 | Exceptional $107,157 |
| Lebanese | 90.5 /100 | #127 | Exceptional $107,086 |
| Immigrants | Ethiopia | 90.0 /100 | #128 | Excellent $106,969 |
| Arabs | 89.9 /100 | #129 | Excellent $106,952 |
| Brazilians | 89.8 /100 | #130 | Excellent $106,942 |
| Canadians | 88.1 /100 | #131 | Excellent $106,597 |
| Immigrants | Fiji | 87.8 /100 | #132 | Excellent $106,544 |
| Ugandans | 87.8 /100 | #133 | Excellent $106,541 |
| Immigrants | Oceania | 87.3 /100 | #134 | Excellent $106,453 |
| Portuguese | 86.3 /100 | #135 | Excellent $106,286 |
| Immigrants | South Eastern Asia | 86.1 /100 | #136 | Excellent $106,252 |