Osage vs Australian Median Family Income
COMPARE
Osage
Australian
Median Family Income
Median Family Income Comparison
Osage
Australians
$91,926
MEDIAN FAMILY INCOME
0.4/ 100
METRIC RATING
258th/ 347
METRIC RANK
$118,440
MEDIAN FAMILY INCOME
100.0/ 100
METRIC RATING
37th/ 347
METRIC RANK
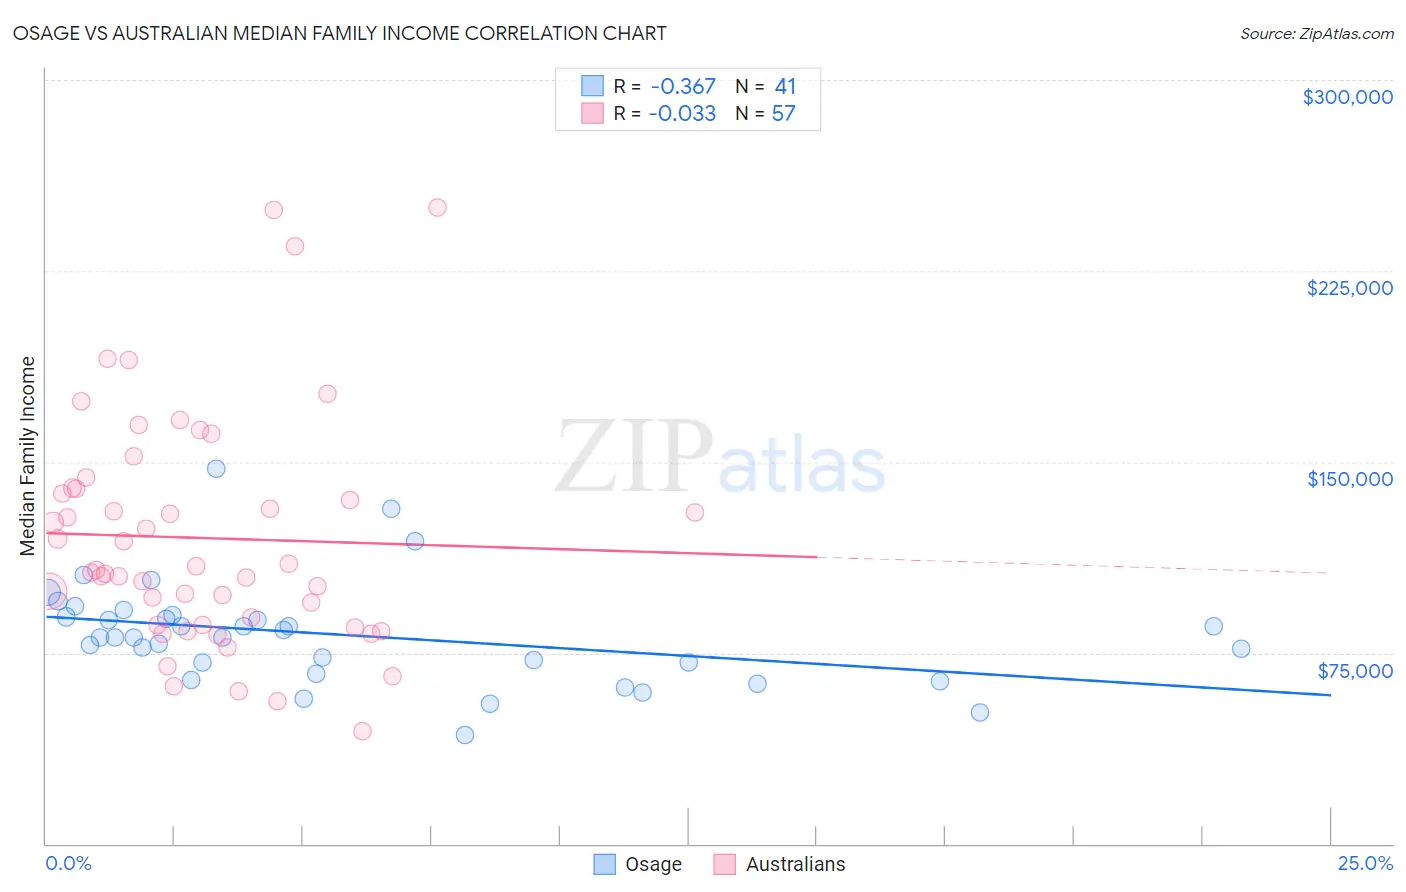
Osage vs Australian Median Family Income Correlation Chart
The statistical analysis conducted on geographies consisting of 91,794,477 people shows a mild negative correlation between the proportion of Osage and median family income in the United States with a correlation coefficient (R) of -0.367 and weighted average of $91,926. Similarly, the statistical analysis conducted on geographies consisting of 223,969,343 people shows no correlation between the proportion of Australians and median family income in the United States with a correlation coefficient (R) of -0.033 and weighted average of $118,440, a difference of 28.8%.
Median Family Income Correlation Summary
| Measurement | Osage | Australian |
| Minimum | $42,500 | $44,219 |
| Maximum | $147,522 | $250,001 |
| Range | $105,022 | $205,782 |
| Mean | $81,978 | $120,063 |
| Median | $81,165 | $107,342 |
| Interquartile 25% (IQ1) | $68,927 | $85,865 |
| Interquartile 75% (IQ3) | $89,553 | $139,651 |
| Interquartile Range (IQR) | $20,626 | $53,786 |
| Standard Deviation (Sample) | $20,387 | $45,096 |
| Standard Deviation (Population) | $20,137 | $44,699 |
Similar Demographics by Median Family Income
Demographics Similar to Osage by Median Family Income
In terms of median family income, the demographic groups most similar to Osage are Cape Verdean ($91,848, a difference of 0.090%), Pennsylvania German ($91,763, a difference of 0.18%), American ($92,096, a difference of 0.19%), Inupiat ($91,730, a difference of 0.21%), and Liberian ($91,722, a difference of 0.22%).
| Demographics | Rating | Rank | Median Family Income |
| Immigrants | Somalia | 0.6 /100 | #251 | Tragic $92,609 |
| Immigrants | El Salvador | 0.6 /100 | #252 | Tragic $92,545 |
| Immigrants | Guyana | 0.6 /100 | #253 | Tragic $92,513 |
| Immigrants | Barbados | 0.5 /100 | #254 | Tragic $92,419 |
| Immigrants | Laos | 0.5 /100 | #255 | Tragic $92,239 |
| Nicaraguans | 0.5 /100 | #256 | Tragic $92,231 |
| Americans | 0.4 /100 | #257 | Tragic $92,096 |
| Osage | 0.4 /100 | #258 | Tragic $91,926 |
| Cape Verdeans | 0.4 /100 | #259 | Tragic $91,848 |
| Pennsylvania Germans | 0.4 /100 | #260 | Tragic $91,763 |
| Inupiat | 0.4 /100 | #261 | Tragic $91,730 |
| Liberians | 0.4 /100 | #262 | Tragic $91,722 |
| Immigrants | West Indies | 0.3 /100 | #263 | Tragic $91,588 |
| Senegalese | 0.3 /100 | #264 | Tragic $91,475 |
| Hmong | 0.3 /100 | #265 | Tragic $91,296 |
Demographics Similar to Australians by Median Family Income
In terms of median family income, the demographic groups most similar to Australians are Immigrants from Turkey ($118,325, a difference of 0.10%), Israeli ($118,577, a difference of 0.12%), Immigrants from Asia ($118,291, a difference of 0.13%), Immigrants from Lithuania ($118,053, a difference of 0.33%), and Estonian ($118,013, a difference of 0.36%).
| Demographics | Rating | Rank | Median Family Income |
| Immigrants | Sri Lanka | 100.0 /100 | #30 | Exceptional $120,263 |
| Immigrants | France | 100.0 /100 | #31 | Exceptional $120,076 |
| Asians | 100.0 /100 | #32 | Exceptional $119,955 |
| Bhutanese | 100.0 /100 | #33 | Exceptional $119,800 |
| Bolivians | 100.0 /100 | #34 | Exceptional $119,479 |
| Soviet Union | 100.0 /100 | #35 | Exceptional $119,262 |
| Israelis | 100.0 /100 | #36 | Exceptional $118,577 |
| Australians | 100.0 /100 | #37 | Exceptional $118,440 |
| Immigrants | Turkey | 100.0 /100 | #38 | Exceptional $118,325 |
| Immigrants | Asia | 100.0 /100 | #39 | Exceptional $118,291 |
| Immigrants | Lithuania | 100.0 /100 | #40 | Exceptional $118,053 |
| Estonians | 100.0 /100 | #41 | Exceptional $118,013 |
| Immigrants | Bolivia | 100.0 /100 | #42 | Exceptional $117,912 |
| Bulgarians | 100.0 /100 | #43 | Exceptional $117,818 |
| Cambodians | 100.0 /100 | #44 | Exceptional $117,780 |