Osage vs Menominee Median Family Income
COMPARE
Osage
Menominee
Median Family Income
Median Family Income Comparison
Osage
Menominee
$91,926
MEDIAN FAMILY INCOME
0.4/ 100
METRIC RATING
258th/ 347
METRIC RANK
$79,563
MEDIAN FAMILY INCOME
0.0/ 100
METRIC RATING
334th/ 347
METRIC RANK
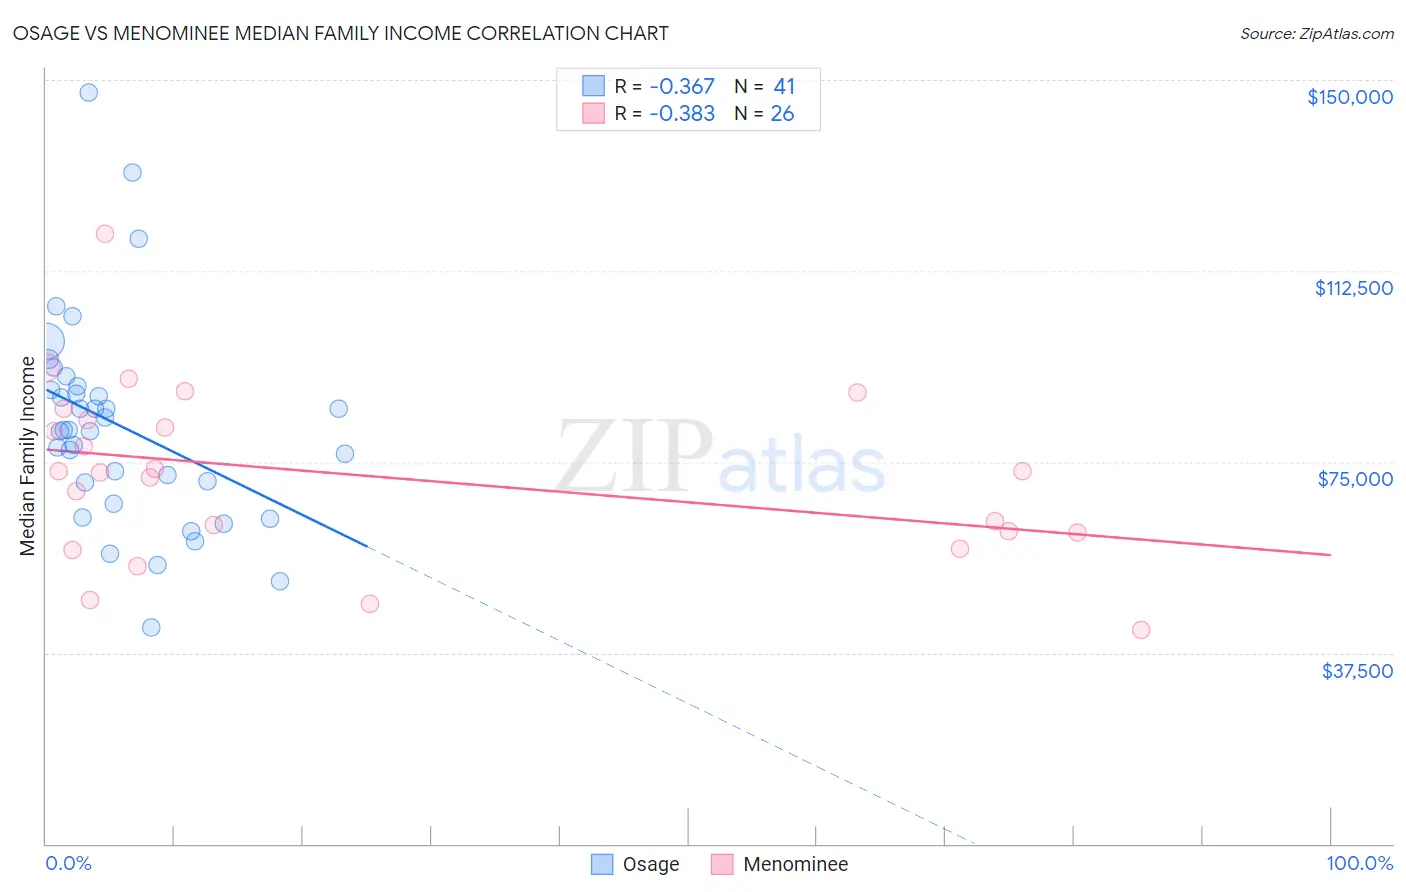
Osage vs Menominee Median Family Income Correlation Chart
The statistical analysis conducted on geographies consisting of 91,794,477 people shows a mild negative correlation between the proportion of Osage and median family income in the United States with a correlation coefficient (R) of -0.367 and weighted average of $91,926. Similarly, the statistical analysis conducted on geographies consisting of 45,777,534 people shows a mild negative correlation between the proportion of Menominee and median family income in the United States with a correlation coefficient (R) of -0.383 and weighted average of $79,563, a difference of 15.5%.
Median Family Income Correlation Summary
| Measurement | Osage | Menominee |
| Minimum | $42,500 | $41,944 |
| Maximum | $147,522 | $119,750 |
| Range | $105,022 | $77,806 |
| Mean | $81,978 | $72,340 |
| Median | $81,165 | $72,940 |
| Interquartile 25% (IQ1) | $68,927 | $61,250 |
| Interquartile 75% (IQ3) | $89,553 | $83,264 |
| Interquartile Range (IQR) | $20,626 | $22,014 |
| Standard Deviation (Sample) | $20,387 | $17,229 |
| Standard Deviation (Population) | $20,137 | $16,895 |
Similar Demographics by Median Family Income
Demographics Similar to Osage by Median Family Income
In terms of median family income, the demographic groups most similar to Osage are Cape Verdean ($91,848, a difference of 0.090%), Pennsylvania German ($91,763, a difference of 0.18%), American ($92,096, a difference of 0.19%), Inupiat ($91,730, a difference of 0.21%), and Liberian ($91,722, a difference of 0.22%).
| Demographics | Rating | Rank | Median Family Income |
| Immigrants | Somalia | 0.6 /100 | #251 | Tragic $92,609 |
| Immigrants | El Salvador | 0.6 /100 | #252 | Tragic $92,545 |
| Immigrants | Guyana | 0.6 /100 | #253 | Tragic $92,513 |
| Immigrants | Barbados | 0.5 /100 | #254 | Tragic $92,419 |
| Immigrants | Laos | 0.5 /100 | #255 | Tragic $92,239 |
| Nicaraguans | 0.5 /100 | #256 | Tragic $92,231 |
| Americans | 0.4 /100 | #257 | Tragic $92,096 |
| Osage | 0.4 /100 | #258 | Tragic $91,926 |
| Cape Verdeans | 0.4 /100 | #259 | Tragic $91,848 |
| Pennsylvania Germans | 0.4 /100 | #260 | Tragic $91,763 |
| Inupiat | 0.4 /100 | #261 | Tragic $91,730 |
| Liberians | 0.4 /100 | #262 | Tragic $91,722 |
| Immigrants | West Indies | 0.3 /100 | #263 | Tragic $91,588 |
| Senegalese | 0.3 /100 | #264 | Tragic $91,475 |
| Hmong | 0.3 /100 | #265 | Tragic $91,296 |
Demographics Similar to Menominee by Median Family Income
In terms of median family income, the demographic groups most similar to Menominee are Yup'ik ($79,290, a difference of 0.34%), Kiowa ($80,885, a difference of 1.7%), Immigrants from Cuba ($78,249, a difference of 1.7%), Native/Alaskan ($80,908, a difference of 1.7%), and Yuman ($78,055, a difference of 1.9%).
| Demographics | Rating | Rank | Median Family Income |
| Arapaho | 0.0 /100 | #327 | Tragic $82,064 |
| Blacks/African Americans | 0.0 /100 | #328 | Tragic $81,912 |
| Dutch West Indians | 0.0 /100 | #329 | Tragic $81,852 |
| Cheyenne | 0.0 /100 | #330 | Tragic $81,385 |
| Immigrants | Dominican Republic | 0.0 /100 | #331 | Tragic $81,233 |
| Natives/Alaskans | 0.0 /100 | #332 | Tragic $80,908 |
| Kiowa | 0.0 /100 | #333 | Tragic $80,885 |
| Menominee | 0.0 /100 | #334 | Tragic $79,563 |
| Yup'ik | 0.0 /100 | #335 | Tragic $79,290 |
| Immigrants | Cuba | 0.0 /100 | #336 | Tragic $78,249 |
| Yuman | 0.0 /100 | #337 | Tragic $78,055 |
| Immigrants | Yemen | 0.0 /100 | #338 | Tragic $77,457 |
| Pima | 0.0 /100 | #339 | Tragic $77,431 |
| Hopi | 0.0 /100 | #340 | Tragic $77,188 |
| Pueblo | 0.0 /100 | #341 | Tragic $76,880 |