Osage vs Alaska Native Median Family Income
COMPARE
Osage
Alaska Native
Median Family Income
Median Family Income Comparison
Osage
Alaska Natives
$91,926
MEDIAN FAMILY INCOME
0.4/ 100
METRIC RATING
258th/ 347
METRIC RANK
$95,573
MEDIAN FAMILY INCOME
2.6/ 100
METRIC RATING
227th/ 347
METRIC RANK
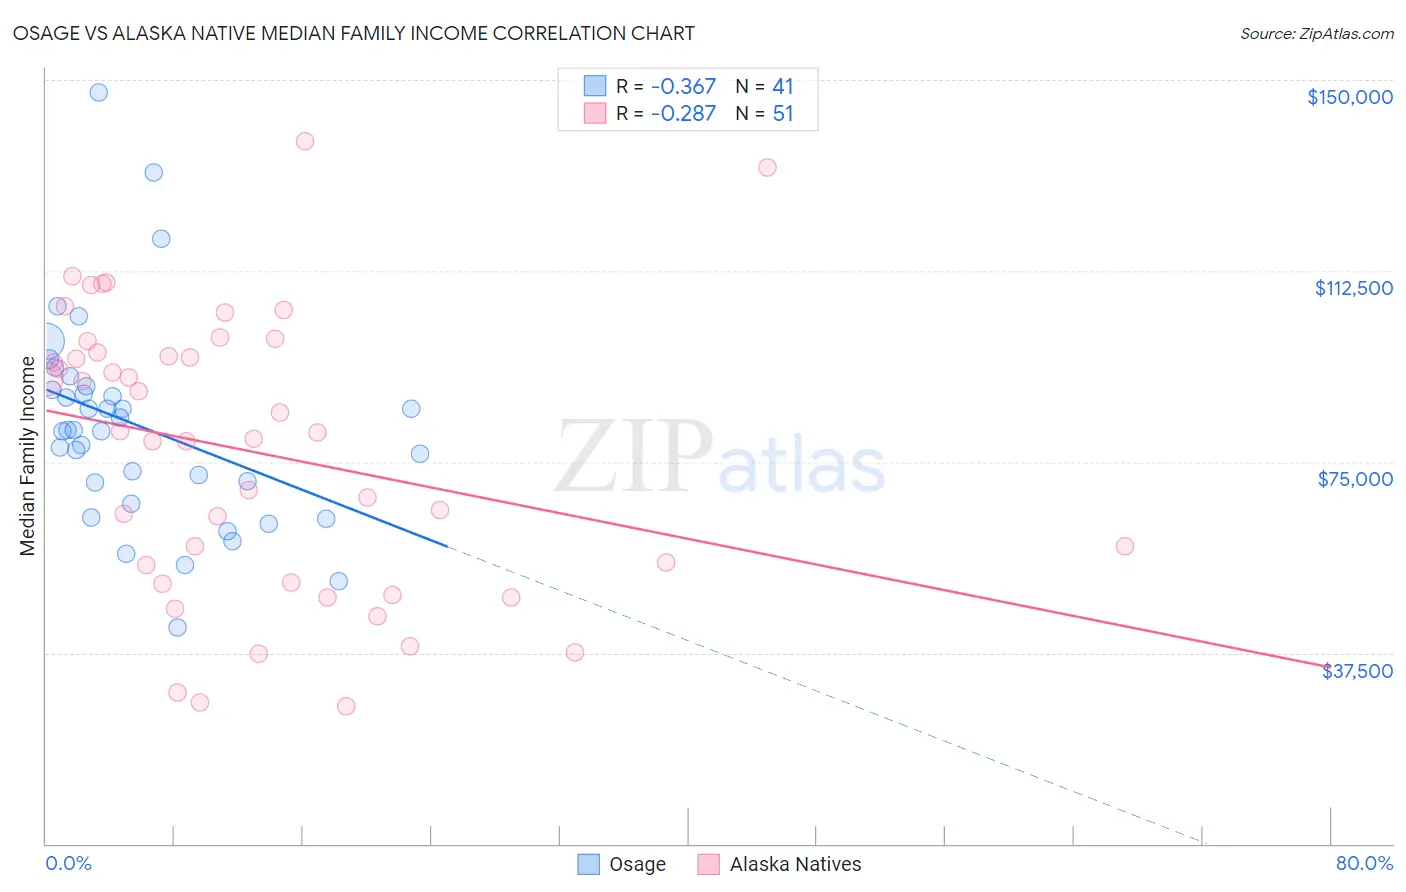
Osage vs Alaska Native Median Family Income Correlation Chart
The statistical analysis conducted on geographies consisting of 91,794,477 people shows a mild negative correlation between the proportion of Osage and median family income in the United States with a correlation coefficient (R) of -0.367 and weighted average of $91,926. Similarly, the statistical analysis conducted on geographies consisting of 76,737,851 people shows a weak negative correlation between the proportion of Alaska Natives and median family income in the United States with a correlation coefficient (R) of -0.287 and weighted average of $95,573, a difference of 4.0%.
Median Family Income Correlation Summary
| Measurement | Osage | Alaska Native |
| Minimum | $42,500 | $27,083 |
| Maximum | $147,522 | $137,917 |
| Range | $105,022 | $110,834 |
| Mean | $81,978 | $77,054 |
| Median | $81,165 | $80,833 |
| Interquartile 25% (IQ1) | $68,927 | $51,316 |
| Interquartile 75% (IQ3) | $89,553 | $96,369 |
| Interquartile Range (IQR) | $20,626 | $45,053 |
| Standard Deviation (Sample) | $20,387 | $27,527 |
| Standard Deviation (Population) | $20,137 | $27,256 |
Similar Demographics by Median Family Income
Demographics Similar to Osage by Median Family Income
In terms of median family income, the demographic groups most similar to Osage are Cape Verdean ($91,848, a difference of 0.090%), Pennsylvania German ($91,763, a difference of 0.18%), American ($92,096, a difference of 0.19%), Inupiat ($91,730, a difference of 0.21%), and Liberian ($91,722, a difference of 0.22%).
| Demographics | Rating | Rank | Median Family Income |
| Immigrants | Somalia | 0.6 /100 | #251 | Tragic $92,609 |
| Immigrants | El Salvador | 0.6 /100 | #252 | Tragic $92,545 |
| Immigrants | Guyana | 0.6 /100 | #253 | Tragic $92,513 |
| Immigrants | Barbados | 0.5 /100 | #254 | Tragic $92,419 |
| Immigrants | Laos | 0.5 /100 | #255 | Tragic $92,239 |
| Nicaraguans | 0.5 /100 | #256 | Tragic $92,231 |
| Americans | 0.4 /100 | #257 | Tragic $92,096 |
| Osage | 0.4 /100 | #258 | Tragic $91,926 |
| Cape Verdeans | 0.4 /100 | #259 | Tragic $91,848 |
| Pennsylvania Germans | 0.4 /100 | #260 | Tragic $91,763 |
| Inupiat | 0.4 /100 | #261 | Tragic $91,730 |
| Liberians | 0.4 /100 | #262 | Tragic $91,722 |
| Immigrants | West Indies | 0.3 /100 | #263 | Tragic $91,588 |
| Senegalese | 0.3 /100 | #264 | Tragic $91,475 |
| Hmong | 0.3 /100 | #265 | Tragic $91,296 |
Demographics Similar to Alaska Natives by Median Family Income
In terms of median family income, the demographic groups most similar to Alaska Natives are Immigrants from Panama ($95,647, a difference of 0.080%), Immigrants from the Azores ($95,402, a difference of 0.18%), Marshallese ($95,293, a difference of 0.29%), Malaysian ($95,230, a difference of 0.36%), and Ecuadorian ($95,114, a difference of 0.48%).
| Demographics | Rating | Rank | Median Family Income |
| Sudanese | 4.7 /100 | #220 | Tragic $96,783 |
| Immigrants | Ghana | 4.2 /100 | #221 | Tragic $96,544 |
| Immigrants | Nigeria | 4.0 /100 | #222 | Tragic $96,439 |
| Venezuelans | 3.7 /100 | #223 | Tragic $96,281 |
| Immigrants | Nonimmigrants | 3.6 /100 | #224 | Tragic $96,231 |
| Vietnamese | 3.4 /100 | #225 | Tragic $96,123 |
| Immigrants | Panama | 2.7 /100 | #226 | Tragic $95,647 |
| Alaska Natives | 2.6 /100 | #227 | Tragic $95,573 |
| Immigrants | Azores | 2.4 /100 | #228 | Tragic $95,402 |
| Marshallese | 2.2 /100 | #229 | Tragic $95,293 |
| Malaysians | 2.2 /100 | #230 | Tragic $95,230 |
| Ecuadorians | 2.1 /100 | #231 | Tragic $95,114 |
| Immigrants | Venezuela | 1.9 /100 | #232 | Tragic $94,904 |
| Immigrants | Bangladesh | 1.6 /100 | #233 | Tragic $94,665 |
| Immigrants | Western Africa | 1.6 /100 | #234 | Tragic $94,638 |