Norwegian vs Paraguayan Median Earnings
COMPARE
Norwegian
Paraguayan
Median Earnings
Median Earnings Comparison
Norwegians
Paraguayans
$46,865
MEDIAN EARNINGS
64.7/ 100
METRIC RATING
164th/ 347
METRIC RANK
$51,068
MEDIAN EARNINGS
99.9/ 100
METRIC RATING
68th/ 347
METRIC RANK
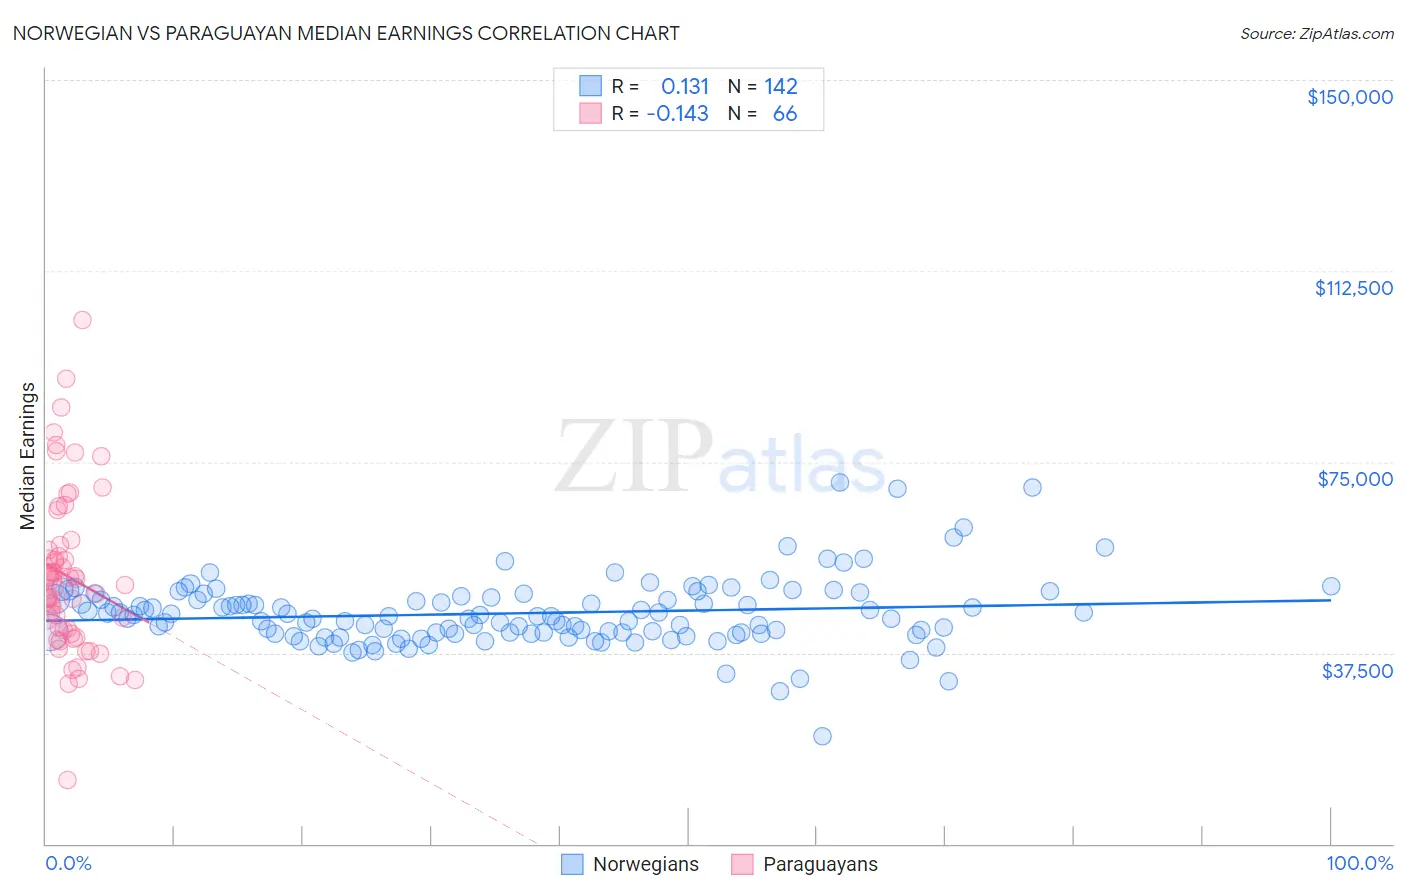
Norwegian vs Paraguayan Median Earnings Correlation Chart
The statistical analysis conducted on geographies consisting of 533,161,956 people shows a poor positive correlation between the proportion of Norwegians and median earnings in the United States with a correlation coefficient (R) of 0.131 and weighted average of $46,865. Similarly, the statistical analysis conducted on geographies consisting of 95,085,692 people shows a poor negative correlation between the proportion of Paraguayans and median earnings in the United States with a correlation coefficient (R) of -0.143 and weighted average of $51,068, a difference of 9.0%.
Median Earnings Correlation Summary
| Measurement | Norwegian | Paraguayan |
| Minimum | $21,029 | $12,403 |
| Maximum | $70,965 | $102,750 |
| Range | $49,936 | $90,347 |
| Mean | $45,261 | $52,505 |
| Median | $44,720 | $51,405 |
| Interquartile 25% (IQ1) | $41,272 | $42,088 |
| Interquartile 75% (IQ3) | $48,283 | $57,643 |
| Interquartile Range (IQR) | $7,011 | $15,555 |
| Standard Deviation (Sample) | $6,752 | $15,766 |
| Standard Deviation (Population) | $6,728 | $15,646 |
Similar Demographics by Median Earnings
Demographics Similar to Norwegians by Median Earnings
In terms of median earnings, the demographic groups most similar to Norwegians are Icelander ($46,916, a difference of 0.11%), South American ($46,804, a difference of 0.13%), South American Indian ($46,952, a difference of 0.18%), Immigrants from Eastern Africa ($46,969, a difference of 0.22%), and Immigrants from Peru ($47,025, a difference of 0.34%).
| Demographics | Rating | Rank | Median Earnings |
| Czechs | 75.1 /100 | #157 | Good $47,221 |
| Slovaks | 71.7 /100 | #158 | Good $47,095 |
| Immigrants | Peru | 69.6 /100 | #159 | Good $47,025 |
| Alsatians | 69.6 /100 | #160 | Good $47,023 |
| Immigrants | Eastern Africa | 68.0 /100 | #161 | Good $46,969 |
| South American Indians | 67.4 /100 | #162 | Good $46,952 |
| Icelanders | 66.3 /100 | #163 | Good $46,916 |
| Norwegians | 64.7 /100 | #164 | Good $46,865 |
| South Americans | 62.7 /100 | #165 | Good $46,804 |
| Czechoslovakians | 57.8 /100 | #166 | Average $46,658 |
| Costa Ricans | 57.4 /100 | #167 | Average $46,645 |
| Immigrants | Africa | 54.6 /100 | #168 | Average $46,564 |
| Immigrants | South America | 54.0 /100 | #169 | Average $46,548 |
| Immigrants | Immigrants | 51.6 /100 | #170 | Average $46,478 |
| Scottish | 51.1 /100 | #171 | Average $46,463 |
Demographics Similar to Paraguayans by Median Earnings
In terms of median earnings, the demographic groups most similar to Paraguayans are Immigrants from Spain ($51,092, a difference of 0.050%), Mongolian ($51,038, a difference of 0.060%), Afghan ($51,112, a difference of 0.090%), Lithuanian ($50,991, a difference of 0.15%), and Immigrants from Ukraine ($50,984, a difference of 0.16%).
| Demographics | Rating | Rank | Median Earnings |
| Immigrants | Latvia | 99.9 /100 | #61 | Exceptional $51,555 |
| Immigrants | Romania | 99.9 /100 | #62 | Exceptional $51,337 |
| Immigrants | Bulgaria | 99.9 /100 | #63 | Exceptional $51,318 |
| New Zealanders | 99.9 /100 | #64 | Exceptional $51,246 |
| Greeks | 99.9 /100 | #65 | Exceptional $51,164 |
| Afghans | 99.9 /100 | #66 | Exceptional $51,112 |
| Immigrants | Spain | 99.9 /100 | #67 | Exceptional $51,092 |
| Paraguayans | 99.9 /100 | #68 | Exceptional $51,068 |
| Mongolians | 99.8 /100 | #69 | Exceptional $51,038 |
| Lithuanians | 99.8 /100 | #70 | Exceptional $50,991 |
| Immigrants | Ukraine | 99.8 /100 | #71 | Exceptional $50,984 |
| Immigrants | Egypt | 99.8 /100 | #72 | Exceptional $50,901 |
| Immigrants | Netherlands | 99.8 /100 | #73 | Exceptional $50,818 |
| South Africans | 99.8 /100 | #74 | Exceptional $50,752 |
| Immigrants | Scotland | 99.8 /100 | #75 | Exceptional $50,741 |