Norwegian vs European Median Earnings
COMPARE
Norwegian
European
Median Earnings
Median Earnings Comparison
Norwegians
Europeans
$46,865
MEDIAN EARNINGS
64.7/ 100
METRIC RATING
164th/ 347
METRIC RANK
$47,915
MEDIAN EARNINGS
88.9/ 100
METRIC RATING
138th/ 347
METRIC RANK
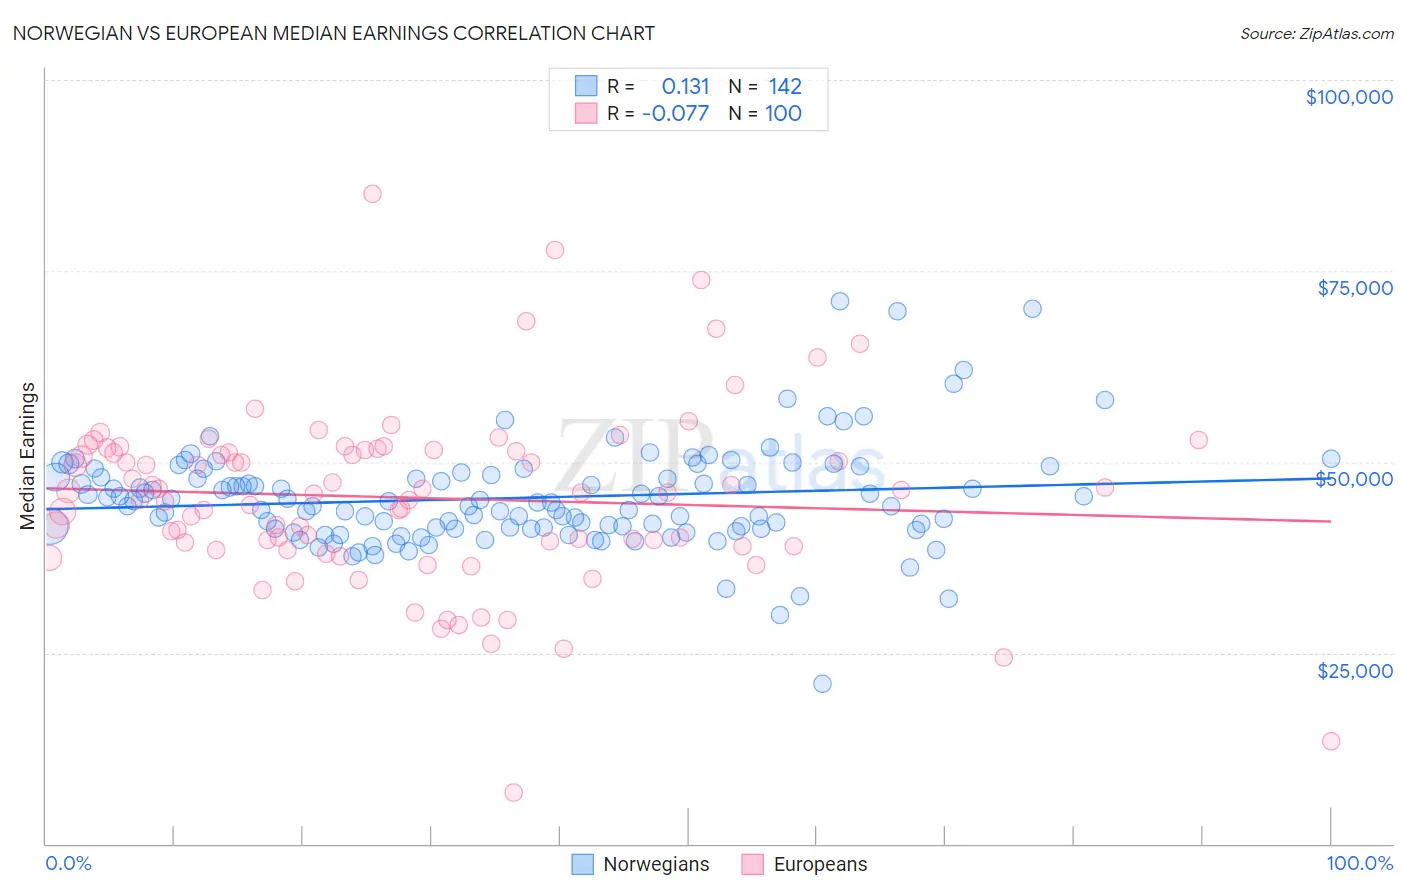
Norwegian vs European Median Earnings Correlation Chart
The statistical analysis conducted on geographies consisting of 533,161,956 people shows a poor positive correlation between the proportion of Norwegians and median earnings in the United States with a correlation coefficient (R) of 0.131 and weighted average of $46,865. Similarly, the statistical analysis conducted on geographies consisting of 561,558,991 people shows a slight negative correlation between the proportion of Europeans and median earnings in the United States with a correlation coefficient (R) of -0.077 and weighted average of $47,915, a difference of 2.2%.
Median Earnings Correlation Summary
| Measurement | Norwegian | European |
| Minimum | $21,029 | $6,651 |
| Maximum | $70,965 | $85,181 |
| Range | $49,936 | $78,530 |
| Mean | $45,261 | $45,294 |
| Median | $44,720 | $45,994 |
| Interquartile 25% (IQ1) | $41,272 | $39,170 |
| Interquartile 75% (IQ3) | $48,283 | $51,535 |
| Interquartile Range (IQR) | $7,011 | $12,364 |
| Standard Deviation (Sample) | $6,752 | $11,738 |
| Standard Deviation (Population) | $6,728 | $11,679 |
Similar Demographics by Median Earnings
Demographics Similar to Norwegians by Median Earnings
In terms of median earnings, the demographic groups most similar to Norwegians are Icelander ($46,916, a difference of 0.11%), South American ($46,804, a difference of 0.13%), South American Indian ($46,952, a difference of 0.18%), Immigrants from Eastern Africa ($46,969, a difference of 0.22%), and Immigrants from Peru ($47,025, a difference of 0.34%).
| Demographics | Rating | Rank | Median Earnings |
| Czechs | 75.1 /100 | #157 | Good $47,221 |
| Slovaks | 71.7 /100 | #158 | Good $47,095 |
| Immigrants | Peru | 69.6 /100 | #159 | Good $47,025 |
| Alsatians | 69.6 /100 | #160 | Good $47,023 |
| Immigrants | Eastern Africa | 68.0 /100 | #161 | Good $46,969 |
| South American Indians | 67.4 /100 | #162 | Good $46,952 |
| Icelanders | 66.3 /100 | #163 | Good $46,916 |
| Norwegians | 64.7 /100 | #164 | Good $46,865 |
| South Americans | 62.7 /100 | #165 | Good $46,804 |
| Czechoslovakians | 57.8 /100 | #166 | Average $46,658 |
| Costa Ricans | 57.4 /100 | #167 | Average $46,645 |
| Immigrants | Africa | 54.6 /100 | #168 | Average $46,564 |
| Immigrants | South America | 54.0 /100 | #169 | Average $46,548 |
| Immigrants | Immigrants | 51.6 /100 | #170 | Average $46,478 |
| Scottish | 51.1 /100 | #171 | Average $46,463 |
Demographics Similar to Europeans by Median Earnings
In terms of median earnings, the demographic groups most similar to Europeans are Canadian ($47,911, a difference of 0.010%), Immigrants from Nepal ($47,925, a difference of 0.020%), Taiwanese ($47,902, a difference of 0.030%), Immigrants from Sierra Leone ($47,875, a difference of 0.080%), and Ugandan ($47,854, a difference of 0.13%).
| Demographics | Rating | Rank | Median Earnings |
| Lebanese | 92.5 /100 | #131 | Exceptional $48,226 |
| British | 92.2 /100 | #132 | Exceptional $48,189 |
| Immigrants | Uganda | 90.5 /100 | #133 | Exceptional $48,041 |
| Sri Lankans | 90.5 /100 | #134 | Exceptional $48,040 |
| Portuguese | 90.4 /100 | #135 | Exceptional $48,032 |
| Slovenes | 90.0 /100 | #136 | Excellent $47,995 |
| Immigrants | Nepal | 89.0 /100 | #137 | Excellent $47,925 |
| Europeans | 88.9 /100 | #138 | Excellent $47,915 |
| Canadians | 88.8 /100 | #139 | Excellent $47,911 |
| Taiwanese | 88.7 /100 | #140 | Excellent $47,902 |
| Immigrants | Sierra Leone | 88.3 /100 | #141 | Excellent $47,875 |
| Ugandans | 88.0 /100 | #142 | Excellent $47,854 |
| Swedes | 88.0 /100 | #143 | Excellent $47,851 |
| Hungarians | 87.1 /100 | #144 | Excellent $47,795 |
| Immigrants | Saudi Arabia | 85.6 /100 | #145 | Excellent $47,704 |