Norwegian vs Sioux Median Earnings
COMPARE
Norwegian
Sioux
Median Earnings
Median Earnings Comparison
Norwegians
Sioux
$46,865
MEDIAN EARNINGS
64.7/ 100
METRIC RATING
164th/ 347
METRIC RANK
$39,448
MEDIAN EARNINGS
0.0/ 100
METRIC RATING
328th/ 347
METRIC RANK
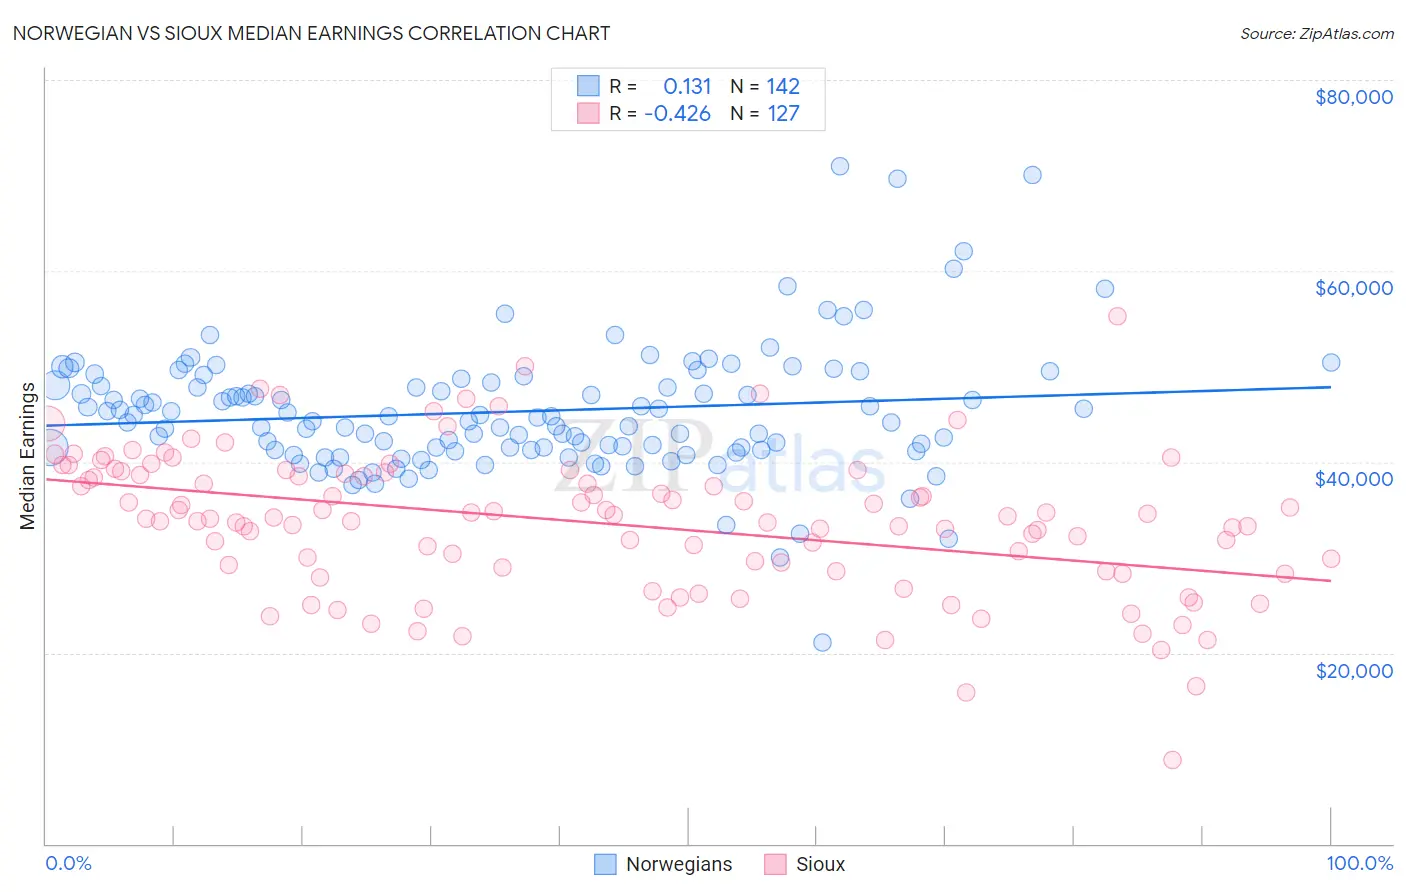
Norwegian vs Sioux Median Earnings Correlation Chart
The statistical analysis conducted on geographies consisting of 533,161,956 people shows a poor positive correlation between the proportion of Norwegians and median earnings in the United States with a correlation coefficient (R) of 0.131 and weighted average of $46,865. Similarly, the statistical analysis conducted on geographies consisting of 234,180,088 people shows a moderate negative correlation between the proportion of Sioux and median earnings in the United States with a correlation coefficient (R) of -0.426 and weighted average of $39,448, a difference of 18.8%.
Median Earnings Correlation Summary
| Measurement | Norwegian | Sioux |
| Minimum | $21,029 | $8,827 |
| Maximum | $70,965 | $55,313 |
| Range | $49,936 | $46,486 |
| Mean | $45,261 | $33,596 |
| Median | $44,720 | $34,101 |
| Interquartile 25% (IQ1) | $41,272 | $28,589 |
| Interquartile 75% (IQ3) | $48,283 | $38,812 |
| Interquartile Range (IQR) | $7,011 | $10,224 |
| Standard Deviation (Sample) | $6,752 | $7,478 |
| Standard Deviation (Population) | $6,728 | $7,448 |
Similar Demographics by Median Earnings
Demographics Similar to Norwegians by Median Earnings
In terms of median earnings, the demographic groups most similar to Norwegians are Icelander ($46,916, a difference of 0.11%), South American ($46,804, a difference of 0.13%), South American Indian ($46,952, a difference of 0.18%), Immigrants from Eastern Africa ($46,969, a difference of 0.22%), and Immigrants from Peru ($47,025, a difference of 0.34%).
| Demographics | Rating | Rank | Median Earnings |
| Czechs | 75.1 /100 | #157 | Good $47,221 |
| Slovaks | 71.7 /100 | #158 | Good $47,095 |
| Immigrants | Peru | 69.6 /100 | #159 | Good $47,025 |
| Alsatians | 69.6 /100 | #160 | Good $47,023 |
| Immigrants | Eastern Africa | 68.0 /100 | #161 | Good $46,969 |
| South American Indians | 67.4 /100 | #162 | Good $46,952 |
| Icelanders | 66.3 /100 | #163 | Good $46,916 |
| Norwegians | 64.7 /100 | #164 | Good $46,865 |
| South Americans | 62.7 /100 | #165 | Good $46,804 |
| Czechoslovakians | 57.8 /100 | #166 | Average $46,658 |
| Costa Ricans | 57.4 /100 | #167 | Average $46,645 |
| Immigrants | Africa | 54.6 /100 | #168 | Average $46,564 |
| Immigrants | South America | 54.0 /100 | #169 | Average $46,548 |
| Immigrants | Immigrants | 51.6 /100 | #170 | Average $46,478 |
| Scottish | 51.1 /100 | #171 | Average $46,463 |
Demographics Similar to Sioux by Median Earnings
In terms of median earnings, the demographic groups most similar to Sioux are Yuman ($39,523, a difference of 0.19%), Immigrants from Yemen ($39,540, a difference of 0.23%), Creek ($39,648, a difference of 0.51%), Kiowa ($39,232, a difference of 0.55%), and Ottawa ($39,721, a difference of 0.69%).
| Demographics | Rating | Rank | Median Earnings |
| Mexicans | 0.0 /100 | #321 | Tragic $39,834 |
| Immigrants | Central America | 0.0 /100 | #322 | Tragic $39,762 |
| Bahamians | 0.0 /100 | #323 | Tragic $39,735 |
| Ottawa | 0.0 /100 | #324 | Tragic $39,721 |
| Creek | 0.0 /100 | #325 | Tragic $39,648 |
| Immigrants | Yemen | 0.0 /100 | #326 | Tragic $39,540 |
| Yuman | 0.0 /100 | #327 | Tragic $39,523 |
| Sioux | 0.0 /100 | #328 | Tragic $39,448 |
| Kiowa | 0.0 /100 | #329 | Tragic $39,232 |
| Immigrants | Congo | 0.0 /100 | #330 | Tragic $39,169 |
| Immigrants | Mexico | 0.0 /100 | #331 | Tragic $39,114 |
| Yakama | 0.0 /100 | #332 | Tragic $39,107 |
| Houma | 0.0 /100 | #333 | Tragic $38,949 |
| Spanish American Indians | 0.0 /100 | #334 | Tragic $38,907 |
| Natives/Alaskans | 0.0 /100 | #335 | Tragic $38,896 |