Norwegian vs Immigrants from Bolivia Female Unemployment
COMPARE
Norwegian
Immigrants from Bolivia
Female Unemployment
Female Unemployment Comparison
Norwegians
Immigrants from Bolivia
4.2%
FEMALE UNEMPLOYMENT
100.0/ 100
METRIC RATING
1st/ 347
METRIC RANK
5.0%
FEMALE UNEMPLOYMENT
98.0/ 100
METRIC RATING
74th/ 347
METRIC RANK
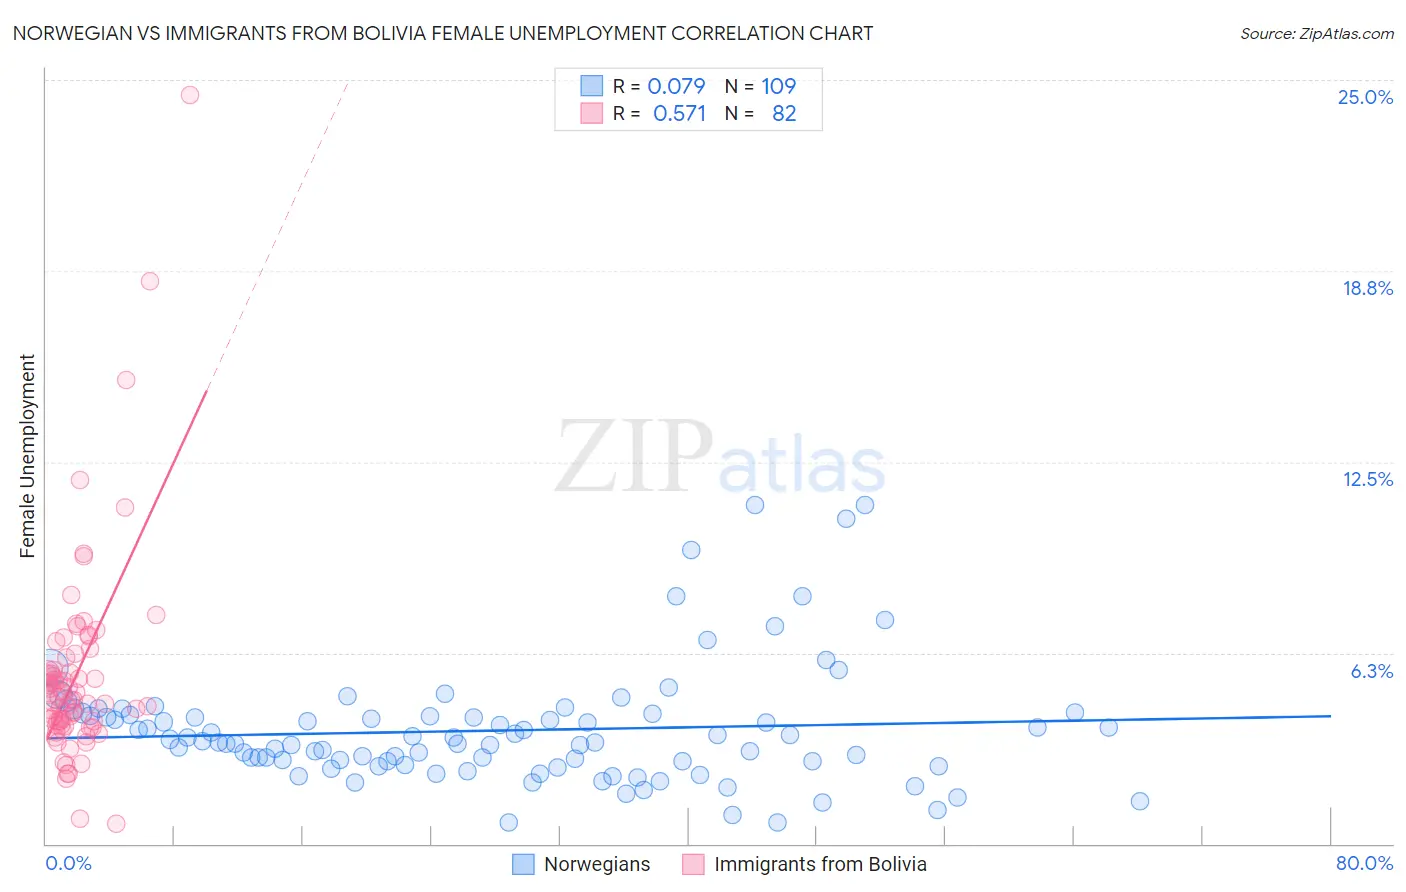
Norwegian vs Immigrants from Bolivia Female Unemployment Correlation Chart
The statistical analysis conducted on geographies consisting of 523,312,817 people shows a slight positive correlation between the proportion of Norwegians and unemploymnet rate among females in the United States with a correlation coefficient (R) of 0.079 and weighted average of 4.2%. Similarly, the statistical analysis conducted on geographies consisting of 158,575,090 people shows a substantial positive correlation between the proportion of Immigrants from Bolivia and unemploymnet rate among females in the United States with a correlation coefficient (R) of 0.571 and weighted average of 5.0%, a difference of 18.8%.
Female Unemployment Correlation Summary
| Measurement | Norwegian | Immigrants from Bolivia |
| Minimum | 0.68% | 0.67% |
| Maximum | 11.1% | 24.5% |
| Range | 10.4% | 23.8% |
| Mean | 3.7% | 5.5% |
| Median | 3.3% | 4.8% |
| Interquartile 25% (IQ1) | 2.6% | 3.9% |
| Interquartile 75% (IQ3) | 4.2% | 5.7% |
| Interquartile Range (IQR) | 1.6% | 1.8% |
| Standard Deviation (Sample) | 1.9% | 3.4% |
| Standard Deviation (Population) | 1.9% | 3.4% |
Similar Demographics by Female Unemployment
Demographics Similar to Norwegians by Female Unemployment
In terms of female unemployment, the demographic groups most similar to Norwegians are Czech (4.4%, a difference of 5.3%), Luxembourger (4.4%, a difference of 5.3%), Danish (4.4%, a difference of 5.4%), Hmong (4.4%, a difference of 5.5%), and Swedish (4.4%, a difference of 6.8%).
| Demographics | Rating | Rank | Female Unemployment |
| Norwegians | 100.0 /100 | #1 | Exceptional 4.2% |
| Czechs | 100.0 /100 | #2 | Exceptional 4.4% |
| Luxembourgers | 100.0 /100 | #3 | Exceptional 4.4% |
| Danes | 100.0 /100 | #4 | Exceptional 4.4% |
| Hmong | 100.0 /100 | #5 | Exceptional 4.4% |
| Swedes | 100.0 /100 | #6 | Exceptional 4.4% |
| Chinese | 100.0 /100 | #7 | Exceptional 4.5% |
| Germans | 100.0 /100 | #8 | Exceptional 4.5% |
| Slovenes | 100.0 /100 | #9 | Exceptional 4.5% |
| Swiss | 100.0 /100 | #10 | Exceptional 4.6% |
| Scandinavians | 100.0 /100 | #11 | Exceptional 4.6% |
| Dutch | 100.0 /100 | #12 | Exceptional 4.6% |
| Belgians | 100.0 /100 | #13 | Exceptional 4.6% |
| Finns | 100.0 /100 | #14 | Exceptional 4.6% |
| English | 100.0 /100 | #15 | Exceptional 4.6% |
Demographics Similar to Immigrants from Bolivia by Female Unemployment
In terms of female unemployment, the demographic groups most similar to Immigrants from Bolivia are Russian (5.0%, a difference of 0.010%), Immigrants from Singapore (5.0%, a difference of 0.020%), Immigrants from Venezuela (5.0%, a difference of 0.030%), Immigrants from Northern Europe (4.9%, a difference of 0.040%), and German Russian (4.9%, a difference of 0.11%).
| Demographics | Rating | Rank | Female Unemployment |
| Cubans | 98.3 /100 | #67 | Exceptional 4.9% |
| Tlingit-Haida | 98.3 /100 | #68 | Exceptional 4.9% |
| Immigrants | Ireland | 98.2 /100 | #69 | Exceptional 4.9% |
| Osage | 98.2 /100 | #70 | Exceptional 4.9% |
| German Russians | 98.1 /100 | #71 | Exceptional 4.9% |
| Immigrants | Northern Europe | 98.0 /100 | #72 | Exceptional 4.9% |
| Russians | 98.0 /100 | #73 | Exceptional 5.0% |
| Immigrants | Bolivia | 98.0 /100 | #74 | Exceptional 5.0% |
| Immigrants | Singapore | 98.0 /100 | #75 | Exceptional 5.0% |
| Immigrants | Venezuela | 97.9 /100 | #76 | Exceptional 5.0% |
| Mongolians | 97.8 /100 | #77 | Exceptional 5.0% |
| Immigrants | Netherlands | 97.8 /100 | #78 | Exceptional 5.0% |
| Turks | 97.6 /100 | #79 | Exceptional 5.0% |
| New Zealanders | 97.4 /100 | #80 | Exceptional 5.0% |
| Filipinos | 97.3 /100 | #81 | Exceptional 5.0% |