Nonimmigrants vs Immigrants from Cambodia Median Female Earnings
COMPARE
Nonimmigrants
Immigrants from Cambodia
Median Female Earnings
Median Female Earnings Comparison
Nonimmigrants
Immigrants from Cambodia
$37,024
MEDIAN FEMALE EARNINGS
0.4/ 100
METRIC RATING
267th/ 347
METRIC RANK
$38,833
MEDIAN FEMALE EARNINGS
14.2/ 100
METRIC RATING
207th/ 347
METRIC RANK
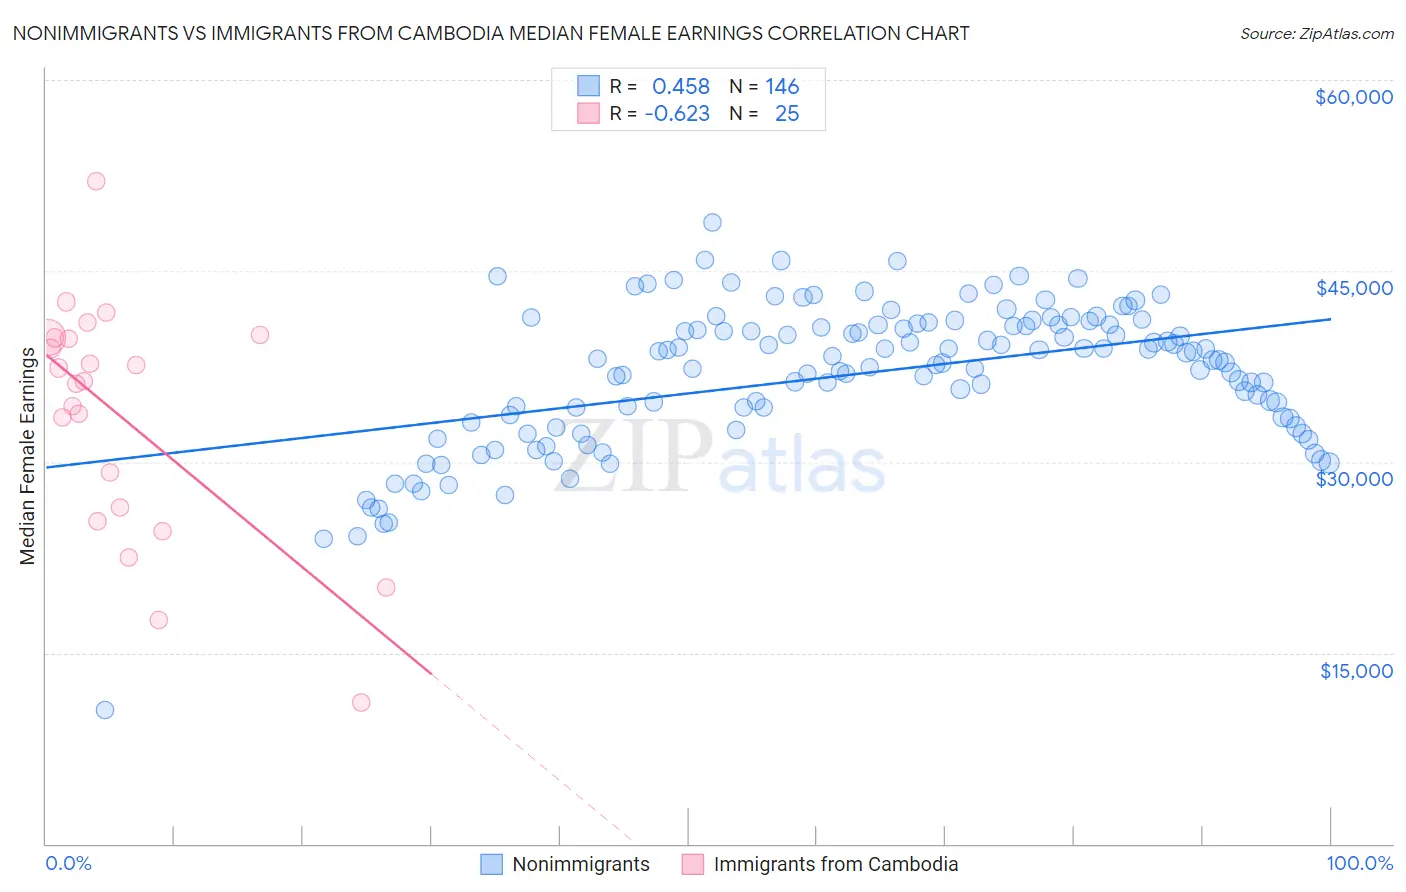
Nonimmigrants vs Immigrants from Cambodia Median Female Earnings Correlation Chart
The statistical analysis conducted on geographies consisting of 581,449,824 people shows a moderate positive correlation between the proportion of Nonimmigrants and median female earnings in the United States with a correlation coefficient (R) of 0.458 and weighted average of $37,024. Similarly, the statistical analysis conducted on geographies consisting of 205,144,839 people shows a significant negative correlation between the proportion of Immigrants from Cambodia and median female earnings in the United States with a correlation coefficient (R) of -0.623 and weighted average of $38,833, a difference of 4.9%.
Median Female Earnings Correlation Summary
| Measurement | Nonimmigrants | Immigrants from Cambodia |
| Minimum | $10,532 | $11,066 |
| Maximum | $48,847 | $52,046 |
| Range | $38,315 | $40,980 |
| Mean | $36,884 | $33,558 |
| Median | $38,067 | $36,286 |
| Interquartile 25% (IQ1) | $33,375 | $25,865 |
| Interquartile 75% (IQ3) | $40,787 | $39,745 |
| Interquartile Range (IQR) | $7,412 | $13,880 |
| Standard Deviation (Sample) | $5,653 | $9,295 |
| Standard Deviation (Population) | $5,634 | $9,107 |
Similar Demographics by Median Female Earnings
Demographics Similar to Nonimmigrants by Median Female Earnings
In terms of median female earnings, the demographic groups most similar to Nonimmigrants are Cree ($37,018, a difference of 0.010%), Dominican ($37,046, a difference of 0.060%), Immigrants from Venezuela ($37,003, a difference of 0.060%), Immigrants from Belize ($37,056, a difference of 0.090%), and Salvadoran ($37,083, a difference of 0.16%).
| Demographics | Rating | Rank | Median Female Earnings |
| Dutch | 0.7 /100 | #260 | Tragic $37,339 |
| Malaysians | 0.7 /100 | #261 | Tragic $37,298 |
| Venezuelans | 0.7 /100 | #262 | Tragic $37,282 |
| German Russians | 0.5 /100 | #263 | Tragic $37,105 |
| Salvadorans | 0.4 /100 | #264 | Tragic $37,083 |
| Immigrants | Belize | 0.4 /100 | #265 | Tragic $37,056 |
| Dominicans | 0.4 /100 | #266 | Tragic $37,046 |
| Immigrants | Nonimmigrants | 0.4 /100 | #267 | Tragic $37,024 |
| Cree | 0.4 /100 | #268 | Tragic $37,018 |
| Immigrants | Venezuela | 0.4 /100 | #269 | Tragic $37,003 |
| French American Indians | 0.3 /100 | #270 | Tragic $36,920 |
| Nicaraguans | 0.3 /100 | #271 | Tragic $36,904 |
| Immigrants | Dominican Republic | 0.3 /100 | #272 | Tragic $36,857 |
| Immigrants | Laos | 0.3 /100 | #273 | Tragic $36,841 |
| Immigrants | El Salvador | 0.2 /100 | #274 | Tragic $36,673 |
Demographics Similar to Immigrants from Cambodia by Median Female Earnings
In terms of median female earnings, the demographic groups most similar to Immigrants from Cambodia are Immigrants from Thailand ($38,810, a difference of 0.060%), Norwegian ($38,802, a difference of 0.080%), Immigrants from Bosnia and Herzegovina ($38,886, a difference of 0.14%), Immigrants from Colombia ($38,913, a difference of 0.20%), and Czechoslovakian ($38,738, a difference of 0.25%).
| Demographics | Rating | Rank | Median Female Earnings |
| Immigrants | Panama | 20.6 /100 | #200 | Fair $39,049 |
| Panamanians | 20.6 /100 | #201 | Fair $39,049 |
| Slovaks | 19.9 /100 | #202 | Poor $39,029 |
| Czechs | 18.7 /100 | #203 | Poor $38,992 |
| Immigrants | Uruguay | 17.3 /100 | #204 | Poor $38,945 |
| Immigrants | Colombia | 16.3 /100 | #205 | Poor $38,913 |
| Immigrants | Bosnia and Herzegovina | 15.6 /100 | #206 | Poor $38,886 |
| Immigrants | Cambodia | 14.2 /100 | #207 | Poor $38,833 |
| Immigrants | Thailand | 13.6 /100 | #208 | Poor $38,810 |
| Norwegians | 13.4 /100 | #209 | Poor $38,802 |
| Czechoslovakians | 12.0 /100 | #210 | Poor $38,738 |
| Aleuts | 11.6 /100 | #211 | Poor $38,719 |
| Guamanians/Chamorros | 11.5 /100 | #212 | Poor $38,717 |
| Jamaicans | 10.5 /100 | #213 | Poor $38,670 |
| Iraqis | 10.5 /100 | #214 | Poor $38,666 |