Nonimmigrants vs Immigrants from Asia Median Female Earnings
COMPARE
Nonimmigrants
Immigrants from Asia
Median Female Earnings
Median Female Earnings Comparison
Nonimmigrants
Immigrants from Asia
$37,024
MEDIAN FEMALE EARNINGS
0.4/ 100
METRIC RATING
267th/ 347
METRIC RANK
$44,198
MEDIAN FEMALE EARNINGS
100.0/ 100
METRIC RATING
33rd/ 347
METRIC RANK
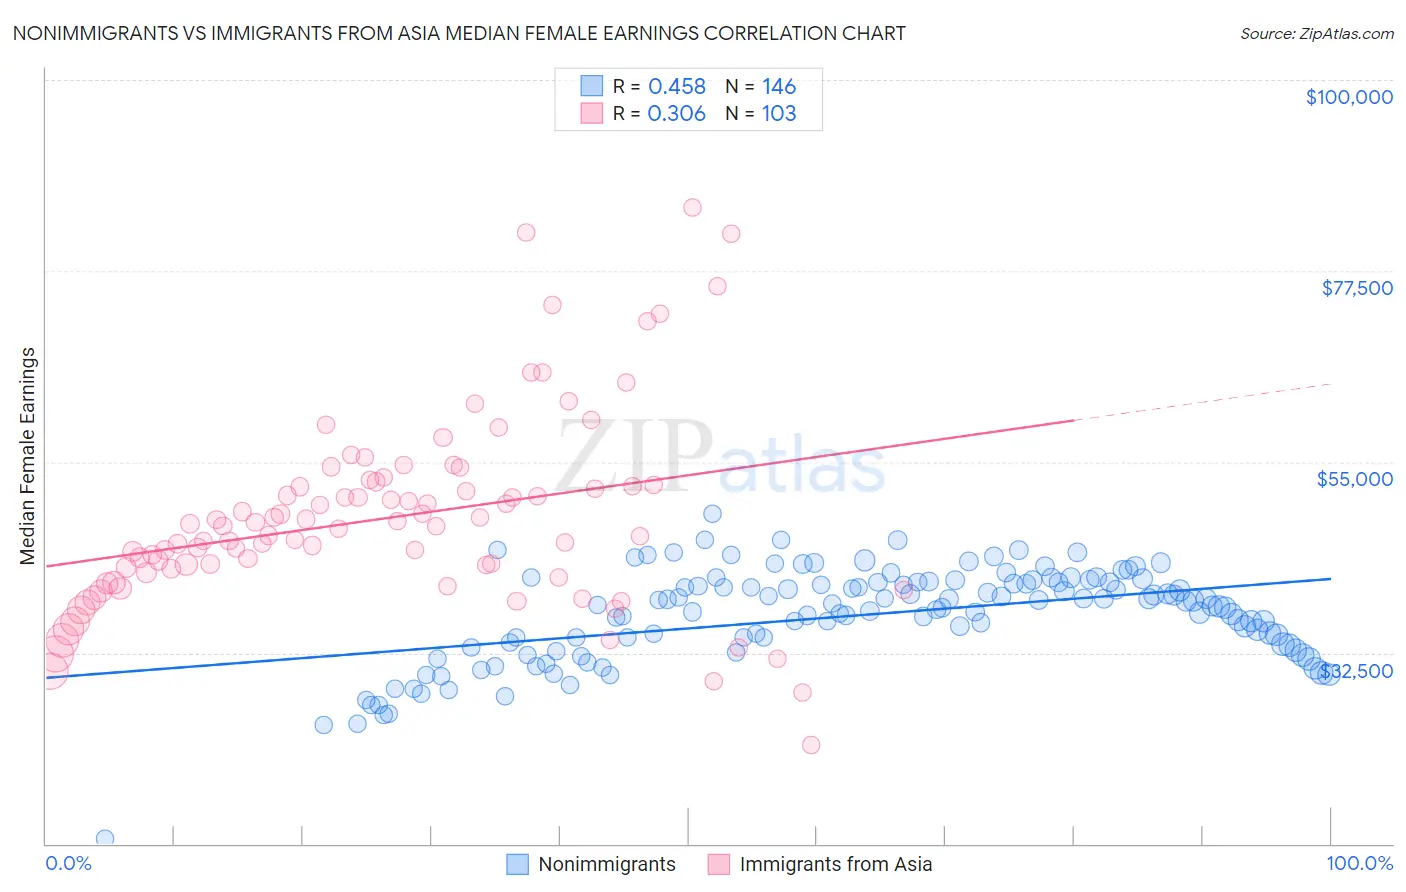
Nonimmigrants vs Immigrants from Asia Median Female Earnings Correlation Chart
The statistical analysis conducted on geographies consisting of 581,449,824 people shows a moderate positive correlation between the proportion of Nonimmigrants and median female earnings in the United States with a correlation coefficient (R) of 0.458 and weighted average of $37,024. Similarly, the statistical analysis conducted on geographies consisting of 548,277,382 people shows a mild positive correlation between the proportion of Immigrants from Asia and median female earnings in the United States with a correlation coefficient (R) of 0.306 and weighted average of $44,198, a difference of 19.4%.
Median Female Earnings Correlation Summary
| Measurement | Nonimmigrants | Immigrants from Asia |
| Minimum | $10,532 | $21,667 |
| Maximum | $48,847 | $84,949 |
| Range | $38,315 | $63,282 |
| Mean | $36,884 | $48,373 |
| Median | $38,067 | $47,404 |
| Interquartile 25% (IQ1) | $33,375 | $41,959 |
| Interquartile 75% (IQ3) | $40,787 | $52,302 |
| Interquartile Range (IQR) | $7,412 | $10,343 |
| Standard Deviation (Sample) | $5,653 | $11,346 |
| Standard Deviation (Population) | $5,634 | $11,291 |
Similar Demographics by Median Female Earnings
Demographics Similar to Nonimmigrants by Median Female Earnings
In terms of median female earnings, the demographic groups most similar to Nonimmigrants are Cree ($37,018, a difference of 0.010%), Dominican ($37,046, a difference of 0.060%), Immigrants from Venezuela ($37,003, a difference of 0.060%), Immigrants from Belize ($37,056, a difference of 0.090%), and Salvadoran ($37,083, a difference of 0.16%).
| Demographics | Rating | Rank | Median Female Earnings |
| Dutch | 0.7 /100 | #260 | Tragic $37,339 |
| Malaysians | 0.7 /100 | #261 | Tragic $37,298 |
| Venezuelans | 0.7 /100 | #262 | Tragic $37,282 |
| German Russians | 0.5 /100 | #263 | Tragic $37,105 |
| Salvadorans | 0.4 /100 | #264 | Tragic $37,083 |
| Immigrants | Belize | 0.4 /100 | #265 | Tragic $37,056 |
| Dominicans | 0.4 /100 | #266 | Tragic $37,046 |
| Immigrants | Nonimmigrants | 0.4 /100 | #267 | Tragic $37,024 |
| Cree | 0.4 /100 | #268 | Tragic $37,018 |
| Immigrants | Venezuela | 0.4 /100 | #269 | Tragic $37,003 |
| French American Indians | 0.3 /100 | #270 | Tragic $36,920 |
| Nicaraguans | 0.3 /100 | #271 | Tragic $36,904 |
| Immigrants | Dominican Republic | 0.3 /100 | #272 | Tragic $36,857 |
| Immigrants | Laos | 0.3 /100 | #273 | Tragic $36,841 |
| Immigrants | El Salvador | 0.2 /100 | #274 | Tragic $36,673 |
Demographics Similar to Immigrants from Asia by Median Female Earnings
In terms of median female earnings, the demographic groups most similar to Immigrants from Asia are Russian ($44,169, a difference of 0.070%), Immigrants from Sri Lanka ($44,161, a difference of 0.080%), Immigrants from Turkey ($44,066, a difference of 0.30%), Immigrants from Northern Europe ($44,366, a difference of 0.38%), and Immigrants from Switzerland ($43,996, a difference of 0.46%).
| Demographics | Rating | Rank | Median Female Earnings |
| Immigrants | Belarus | 100.0 /100 | #26 | Exceptional $44,757 |
| Turks | 100.0 /100 | #27 | Exceptional $44,695 |
| Immigrants | Russia | 100.0 /100 | #28 | Exceptional $44,680 |
| Immigrants | Belgium | 100.0 /100 | #29 | Exceptional $44,587 |
| Asians | 100.0 /100 | #30 | Exceptional $44,586 |
| Immigrants | France | 100.0 /100 | #31 | Exceptional $44,541 |
| Immigrants | Northern Europe | 100.0 /100 | #32 | Exceptional $44,366 |
| Immigrants | Asia | 100.0 /100 | #33 | Exceptional $44,198 |
| Russians | 100.0 /100 | #34 | Exceptional $44,169 |
| Immigrants | Sri Lanka | 100.0 /100 | #35 | Exceptional $44,161 |
| Immigrants | Turkey | 100.0 /100 | #36 | Exceptional $44,066 |
| Immigrants | Switzerland | 100.0 /100 | #37 | Exceptional $43,996 |
| Latvians | 100.0 /100 | #38 | Exceptional $43,941 |
| Israelis | 100.0 /100 | #39 | Exceptional $43,852 |
| Immigrants | Malaysia | 100.0 /100 | #40 | Exceptional $43,835 |