Nonimmigrants vs Immigrants from Croatia Median Female Earnings
COMPARE
Nonimmigrants
Immigrants from Croatia
Median Female Earnings
Median Female Earnings Comparison
Nonimmigrants
Immigrants from Croatia
$37,024
MEDIAN FEMALE EARNINGS
0.4/ 100
METRIC RATING
267th/ 347
METRIC RANK
$43,258
MEDIAN FEMALE EARNINGS
99.9/ 100
METRIC RATING
56th/ 347
METRIC RANK
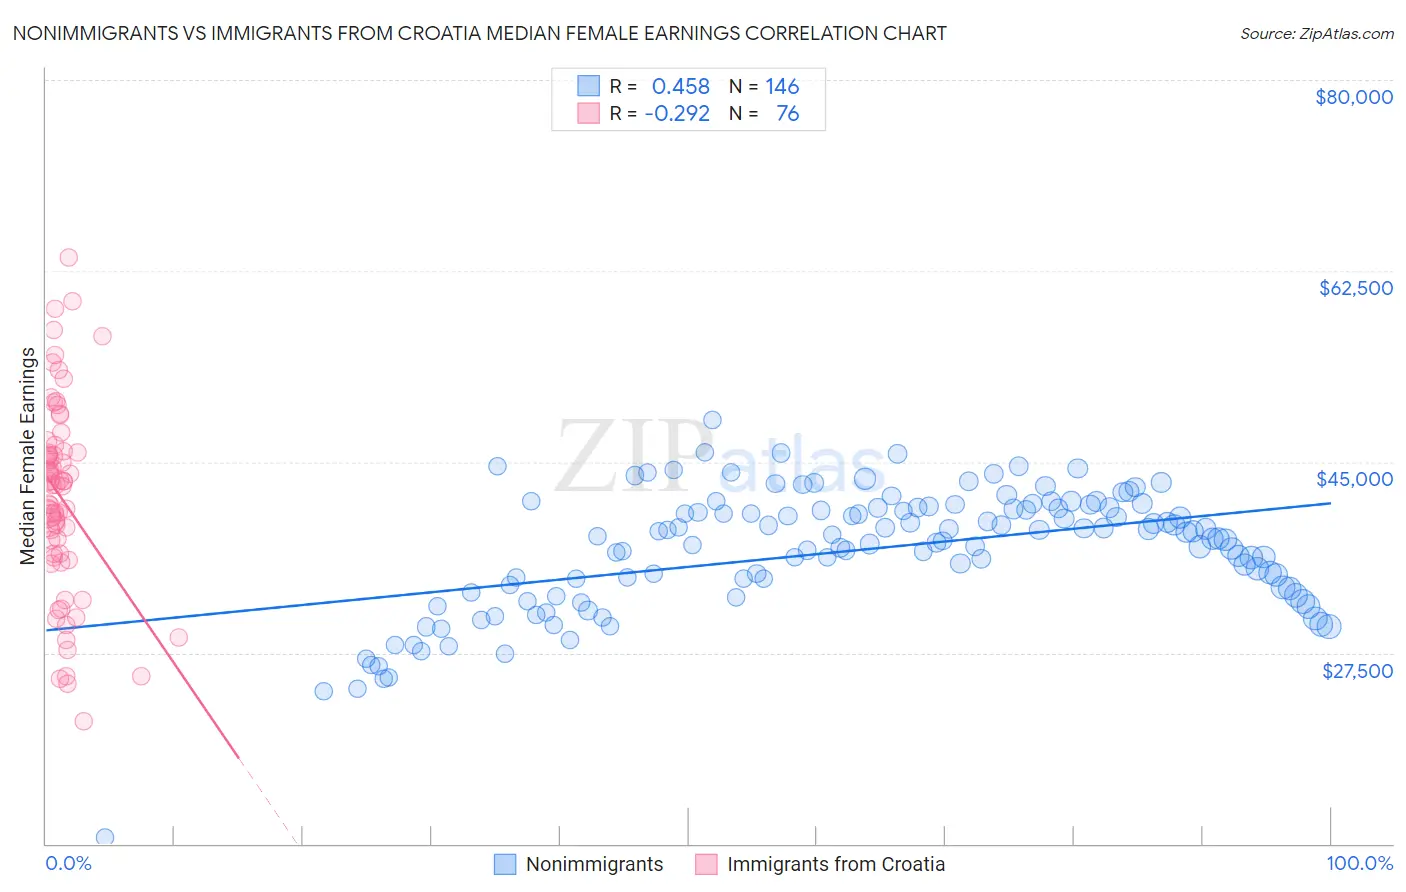
Nonimmigrants vs Immigrants from Croatia Median Female Earnings Correlation Chart
The statistical analysis conducted on geographies consisting of 581,449,824 people shows a moderate positive correlation between the proportion of Nonimmigrants and median female earnings in the United States with a correlation coefficient (R) of 0.458 and weighted average of $37,024. Similarly, the statistical analysis conducted on geographies consisting of 132,568,368 people shows a weak negative correlation between the proportion of Immigrants from Croatia and median female earnings in the United States with a correlation coefficient (R) of -0.292 and weighted average of $43,258, a difference of 16.8%.
Median Female Earnings Correlation Summary
| Measurement | Nonimmigrants | Immigrants from Croatia |
| Minimum | $10,532 | $21,250 |
| Maximum | $48,847 | $63,753 |
| Range | $38,315 | $42,503 |
| Mean | $36,884 | $41,680 |
| Median | $38,067 | $42,916 |
| Interquartile 25% (IQ1) | $33,375 | $36,403 |
| Interquartile 75% (IQ3) | $40,787 | $45,910 |
| Interquartile Range (IQR) | $7,412 | $9,507 |
| Standard Deviation (Sample) | $5,653 | $8,879 |
| Standard Deviation (Population) | $5,634 | $8,820 |
Similar Demographics by Median Female Earnings
Demographics Similar to Nonimmigrants by Median Female Earnings
In terms of median female earnings, the demographic groups most similar to Nonimmigrants are Cree ($37,018, a difference of 0.010%), Dominican ($37,046, a difference of 0.060%), Immigrants from Venezuela ($37,003, a difference of 0.060%), Immigrants from Belize ($37,056, a difference of 0.090%), and Salvadoran ($37,083, a difference of 0.16%).
| Demographics | Rating | Rank | Median Female Earnings |
| Dutch | 0.7 /100 | #260 | Tragic $37,339 |
| Malaysians | 0.7 /100 | #261 | Tragic $37,298 |
| Venezuelans | 0.7 /100 | #262 | Tragic $37,282 |
| German Russians | 0.5 /100 | #263 | Tragic $37,105 |
| Salvadorans | 0.4 /100 | #264 | Tragic $37,083 |
| Immigrants | Belize | 0.4 /100 | #265 | Tragic $37,056 |
| Dominicans | 0.4 /100 | #266 | Tragic $37,046 |
| Immigrants | Nonimmigrants | 0.4 /100 | #267 | Tragic $37,024 |
| Cree | 0.4 /100 | #268 | Tragic $37,018 |
| Immigrants | Venezuela | 0.4 /100 | #269 | Tragic $37,003 |
| French American Indians | 0.3 /100 | #270 | Tragic $36,920 |
| Nicaraguans | 0.3 /100 | #271 | Tragic $36,904 |
| Immigrants | Dominican Republic | 0.3 /100 | #272 | Tragic $36,857 |
| Immigrants | Laos | 0.3 /100 | #273 | Tragic $36,841 |
| Immigrants | El Salvador | 0.2 /100 | #274 | Tragic $36,673 |
Demographics Similar to Immigrants from Croatia by Median Female Earnings
In terms of median female earnings, the demographic groups most similar to Immigrants from Croatia are Ethiopian ($43,243, a difference of 0.040%), Australian ($43,308, a difference of 0.11%), Egyptian ($43,305, a difference of 0.11%), Immigrants from Eastern Europe ($43,309, a difference of 0.12%), and Immigrants from Lithuania ($43,317, a difference of 0.14%).
| Demographics | Rating | Rank | Median Female Earnings |
| Immigrants | Serbia | 100.0 /100 | #49 | Exceptional $43,385 |
| Immigrants | Uzbekistan | 100.0 /100 | #50 | Exceptional $43,363 |
| Maltese | 100.0 /100 | #51 | Exceptional $43,357 |
| Immigrants | Lithuania | 99.9 /100 | #52 | Exceptional $43,317 |
| Immigrants | Eastern Europe | 99.9 /100 | #53 | Exceptional $43,309 |
| Australians | 99.9 /100 | #54 | Exceptional $43,308 |
| Egyptians | 99.9 /100 | #55 | Exceptional $43,305 |
| Immigrants | Croatia | 99.9 /100 | #56 | Exceptional $43,258 |
| Ethiopians | 99.9 /100 | #57 | Exceptional $43,243 |
| Paraguayans | 99.9 /100 | #58 | Exceptional $43,173 |
| Estonians | 99.9 /100 | #59 | Exceptional $43,106 |
| Immigrants | Latvia | 99.9 /100 | #60 | Exceptional $43,099 |
| Immigrants | Bulgaria | 99.9 /100 | #61 | Exceptional $43,085 |
| Afghans | 99.9 /100 | #62 | Exceptional $43,077 |
| Immigrants | Ukraine | 99.9 /100 | #63 | Exceptional $43,069 |