Immigrants from Armenia vs Immigrants from Cambodia Median Female Earnings
COMPARE
Immigrants from Armenia
Immigrants from Cambodia
Median Female Earnings
Median Female Earnings Comparison
Immigrants from Armenia
Immigrants from Cambodia
$40,340
MEDIAN FEMALE EARNINGS
79.2/ 100
METRIC RATING
151st/ 347
METRIC RANK
$38,833
MEDIAN FEMALE EARNINGS
14.2/ 100
METRIC RATING
207th/ 347
METRIC RANK
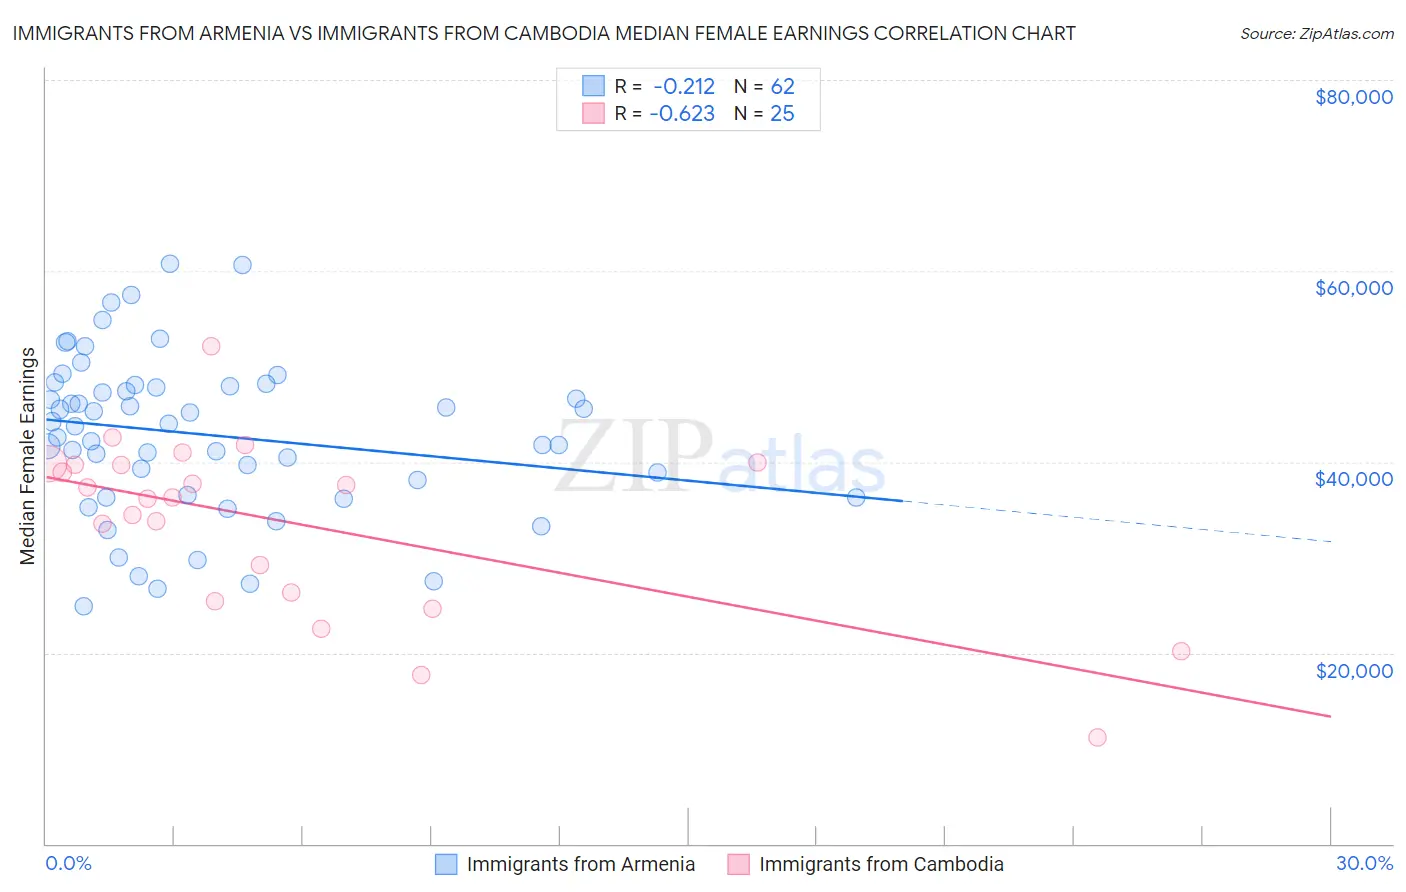
Immigrants from Armenia vs Immigrants from Cambodia Median Female Earnings Correlation Chart
The statistical analysis conducted on geographies consisting of 97,714,677 people shows a weak negative correlation between the proportion of Immigrants from Armenia and median female earnings in the United States with a correlation coefficient (R) of -0.212 and weighted average of $40,340. Similarly, the statistical analysis conducted on geographies consisting of 205,144,839 people shows a significant negative correlation between the proportion of Immigrants from Cambodia and median female earnings in the United States with a correlation coefficient (R) of -0.623 and weighted average of $38,833, a difference of 3.9%.
Median Female Earnings Correlation Summary
| Measurement | Immigrants from Armenia | Immigrants from Cambodia |
| Minimum | $24,884 | $11,066 |
| Maximum | $60,766 | $52,046 |
| Range | $35,882 | $40,980 |
| Mean | $42,818 | $33,558 |
| Median | $43,807 | $36,286 |
| Interquartile 25% (IQ1) | $36,510 | $25,865 |
| Interquartile 75% (IQ3) | $47,965 | $39,745 |
| Interquartile Range (IQR) | $11,455 | $13,880 |
| Standard Deviation (Sample) | $8,342 | $9,295 |
| Standard Deviation (Population) | $8,274 | $9,107 |
Similar Demographics by Median Female Earnings
Demographics Similar to Immigrants from Armenia by Median Female Earnings
In terms of median female earnings, the demographic groups most similar to Immigrants from Armenia are Immigrants from Cameroon ($40,354, a difference of 0.030%), Immigrants from Chile ($40,353, a difference of 0.030%), West Indian ($40,317, a difference of 0.060%), Polish ($40,371, a difference of 0.080%), and Vietnamese ($40,377, a difference of 0.090%).
| Demographics | Rating | Rank | Median Female Earnings |
| Immigrants | North Macedonia | 83.8 /100 | #144 | Excellent $40,488 |
| Brazilians | 83.6 /100 | #145 | Excellent $40,483 |
| Ghanaians | 82.1 /100 | #146 | Excellent $40,429 |
| Vietnamese | 80.4 /100 | #147 | Excellent $40,377 |
| Poles | 80.2 /100 | #148 | Excellent $40,371 |
| Immigrants | Cameroon | 79.7 /100 | #149 | Good $40,354 |
| Immigrants | Chile | 79.6 /100 | #150 | Good $40,353 |
| Immigrants | Armenia | 79.2 /100 | #151 | Good $40,340 |
| West Indians | 78.4 /100 | #152 | Good $40,317 |
| British West Indians | 77.7 /100 | #153 | Good $40,299 |
| Immigrants | Oceania | 77.6 /100 | #154 | Good $40,297 |
| Immigrants | Africa | 76.2 /100 | #155 | Good $40,257 |
| Peruvians | 75.3 /100 | #156 | Good $40,234 |
| Portuguese | 73.0 /100 | #157 | Good $40,177 |
| Immigrants | Senegal | 72.2 /100 | #158 | Good $40,157 |
Demographics Similar to Immigrants from Cambodia by Median Female Earnings
In terms of median female earnings, the demographic groups most similar to Immigrants from Cambodia are Immigrants from Thailand ($38,810, a difference of 0.060%), Norwegian ($38,802, a difference of 0.080%), Immigrants from Bosnia and Herzegovina ($38,886, a difference of 0.14%), Immigrants from Colombia ($38,913, a difference of 0.20%), and Czechoslovakian ($38,738, a difference of 0.25%).
| Demographics | Rating | Rank | Median Female Earnings |
| Immigrants | Panama | 20.6 /100 | #200 | Fair $39,049 |
| Panamanians | 20.6 /100 | #201 | Fair $39,049 |
| Slovaks | 19.9 /100 | #202 | Poor $39,029 |
| Czechs | 18.7 /100 | #203 | Poor $38,992 |
| Immigrants | Uruguay | 17.3 /100 | #204 | Poor $38,945 |
| Immigrants | Colombia | 16.3 /100 | #205 | Poor $38,913 |
| Immigrants | Bosnia and Herzegovina | 15.6 /100 | #206 | Poor $38,886 |
| Immigrants | Cambodia | 14.2 /100 | #207 | Poor $38,833 |
| Immigrants | Thailand | 13.6 /100 | #208 | Poor $38,810 |
| Norwegians | 13.4 /100 | #209 | Poor $38,802 |
| Czechoslovakians | 12.0 /100 | #210 | Poor $38,738 |
| Aleuts | 11.6 /100 | #211 | Poor $38,719 |
| Guamanians/Chamorros | 11.5 /100 | #212 | Poor $38,717 |
| Jamaicans | 10.5 /100 | #213 | Poor $38,670 |
| Iraqis | 10.5 /100 | #214 | Poor $38,666 |