Nonimmigrants vs Immigrants from Eastern Asia Median Female Earnings
COMPARE
Nonimmigrants
Immigrants from Eastern Asia
Median Female Earnings
Median Female Earnings Comparison
Nonimmigrants
Immigrants from Eastern Asia
$37,024
MEDIAN FEMALE EARNINGS
0.4/ 100
METRIC RATING
267th/ 347
METRIC RANK
$46,502
MEDIAN FEMALE EARNINGS
100.0/ 100
METRIC RATING
15th/ 347
METRIC RANK
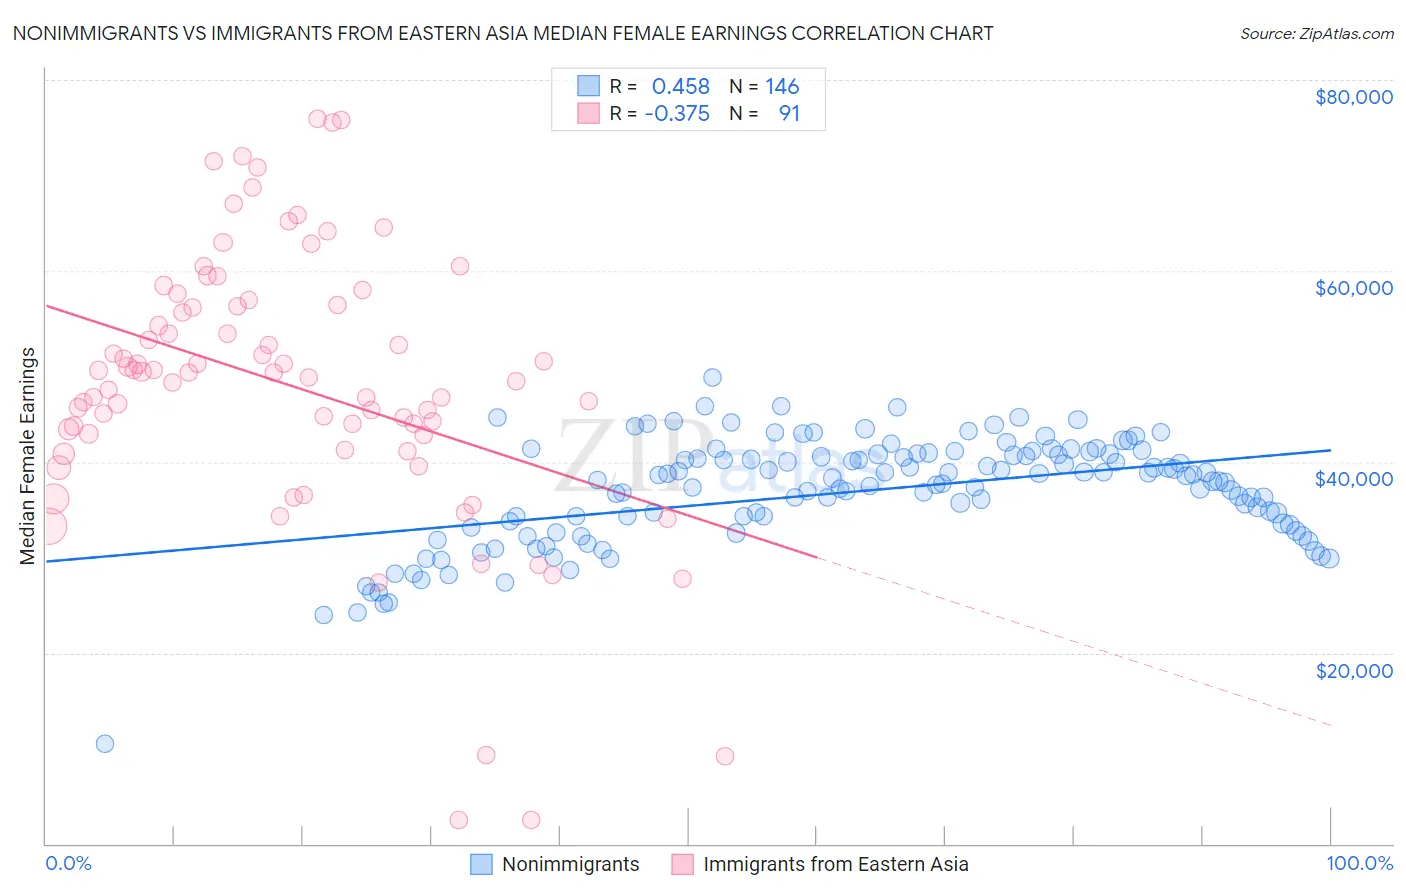
Nonimmigrants vs Immigrants from Eastern Asia Median Female Earnings Correlation Chart
The statistical analysis conducted on geographies consisting of 581,449,824 people shows a moderate positive correlation between the proportion of Nonimmigrants and median female earnings in the United States with a correlation coefficient (R) of 0.458 and weighted average of $37,024. Similarly, the statistical analysis conducted on geographies consisting of 499,525,371 people shows a mild negative correlation between the proportion of Immigrants from Eastern Asia and median female earnings in the United States with a correlation coefficient (R) of -0.375 and weighted average of $46,502, a difference of 25.6%.
Median Female Earnings Correlation Summary
| Measurement | Nonimmigrants | Immigrants from Eastern Asia |
| Minimum | $10,532 | $2,499 |
| Maximum | $48,847 | $75,958 |
| Range | $38,315 | $73,459 |
| Mean | $36,884 | $48,076 |
| Median | $38,067 | $49,327 |
| Interquartile 25% (IQ1) | $33,375 | $42,770 |
| Interquartile 75% (IQ3) | $40,787 | $56,452 |
| Interquartile Range (IQR) | $7,412 | $13,682 |
| Standard Deviation (Sample) | $5,653 | $14,424 |
| Standard Deviation (Population) | $5,634 | $14,344 |
Similar Demographics by Median Female Earnings
Demographics Similar to Nonimmigrants by Median Female Earnings
In terms of median female earnings, the demographic groups most similar to Nonimmigrants are Cree ($37,018, a difference of 0.010%), Dominican ($37,046, a difference of 0.060%), Immigrants from Venezuela ($37,003, a difference of 0.060%), Immigrants from Belize ($37,056, a difference of 0.090%), and Salvadoran ($37,083, a difference of 0.16%).
| Demographics | Rating | Rank | Median Female Earnings |
| Dutch | 0.7 /100 | #260 | Tragic $37,339 |
| Malaysians | 0.7 /100 | #261 | Tragic $37,298 |
| Venezuelans | 0.7 /100 | #262 | Tragic $37,282 |
| German Russians | 0.5 /100 | #263 | Tragic $37,105 |
| Salvadorans | 0.4 /100 | #264 | Tragic $37,083 |
| Immigrants | Belize | 0.4 /100 | #265 | Tragic $37,056 |
| Dominicans | 0.4 /100 | #266 | Tragic $37,046 |
| Immigrants | Nonimmigrants | 0.4 /100 | #267 | Tragic $37,024 |
| Cree | 0.4 /100 | #268 | Tragic $37,018 |
| Immigrants | Venezuela | 0.4 /100 | #269 | Tragic $37,003 |
| French American Indians | 0.3 /100 | #270 | Tragic $36,920 |
| Nicaraguans | 0.3 /100 | #271 | Tragic $36,904 |
| Immigrants | Dominican Republic | 0.3 /100 | #272 | Tragic $36,857 |
| Immigrants | Laos | 0.3 /100 | #273 | Tragic $36,841 |
| Immigrants | El Salvador | 0.2 /100 | #274 | Tragic $36,673 |
Demographics Similar to Immigrants from Eastern Asia by Median Female Earnings
In terms of median female earnings, the demographic groups most similar to Immigrants from Eastern Asia are Indian (Asian) ($46,481, a difference of 0.050%), Soviet Union ($46,556, a difference of 0.11%), Immigrants from Australia ($46,573, a difference of 0.15%), Immigrants from South Central Asia ($46,324, a difference of 0.39%), and Immigrants from Israel ($46,902, a difference of 0.86%).
| Demographics | Rating | Rank | Median Female Earnings |
| Iranians | 100.0 /100 | #8 | Exceptional $47,421 |
| Immigrants | Iran | 100.0 /100 | #9 | Exceptional $47,154 |
| Immigrants | China | 100.0 /100 | #10 | Exceptional $46,972 |
| Okinawans | 100.0 /100 | #11 | Exceptional $46,905 |
| Immigrants | Israel | 100.0 /100 | #12 | Exceptional $46,902 |
| Immigrants | Australia | 100.0 /100 | #13 | Exceptional $46,573 |
| Soviet Union | 100.0 /100 | #14 | Exceptional $46,556 |
| Immigrants | Eastern Asia | 100.0 /100 | #15 | Exceptional $46,502 |
| Indians (Asian) | 100.0 /100 | #16 | Exceptional $46,481 |
| Immigrants | South Central Asia | 100.0 /100 | #17 | Exceptional $46,324 |
| Cypriots | 100.0 /100 | #18 | Exceptional $45,570 |
| Eastern Europeans | 100.0 /100 | #19 | Exceptional $45,385 |
| Immigrants | Japan | 100.0 /100 | #20 | Exceptional $45,323 |
| Cambodians | 100.0 /100 | #21 | Exceptional $45,014 |
| Immigrants | Greece | 100.0 /100 | #22 | Exceptional $44,976 |