Nonimmigrants vs Immigrants from Argentina Median Female Earnings
COMPARE
Nonimmigrants
Immigrants from Argentina
Median Female Earnings
Median Female Earnings Comparison
Nonimmigrants
Immigrants from Argentina
$37,024
MEDIAN FEMALE EARNINGS
0.4/ 100
METRIC RATING
267th/ 347
METRIC RANK
$41,554
MEDIAN FEMALE EARNINGS
97.9/ 100
METRIC RATING
103rd/ 347
METRIC RANK
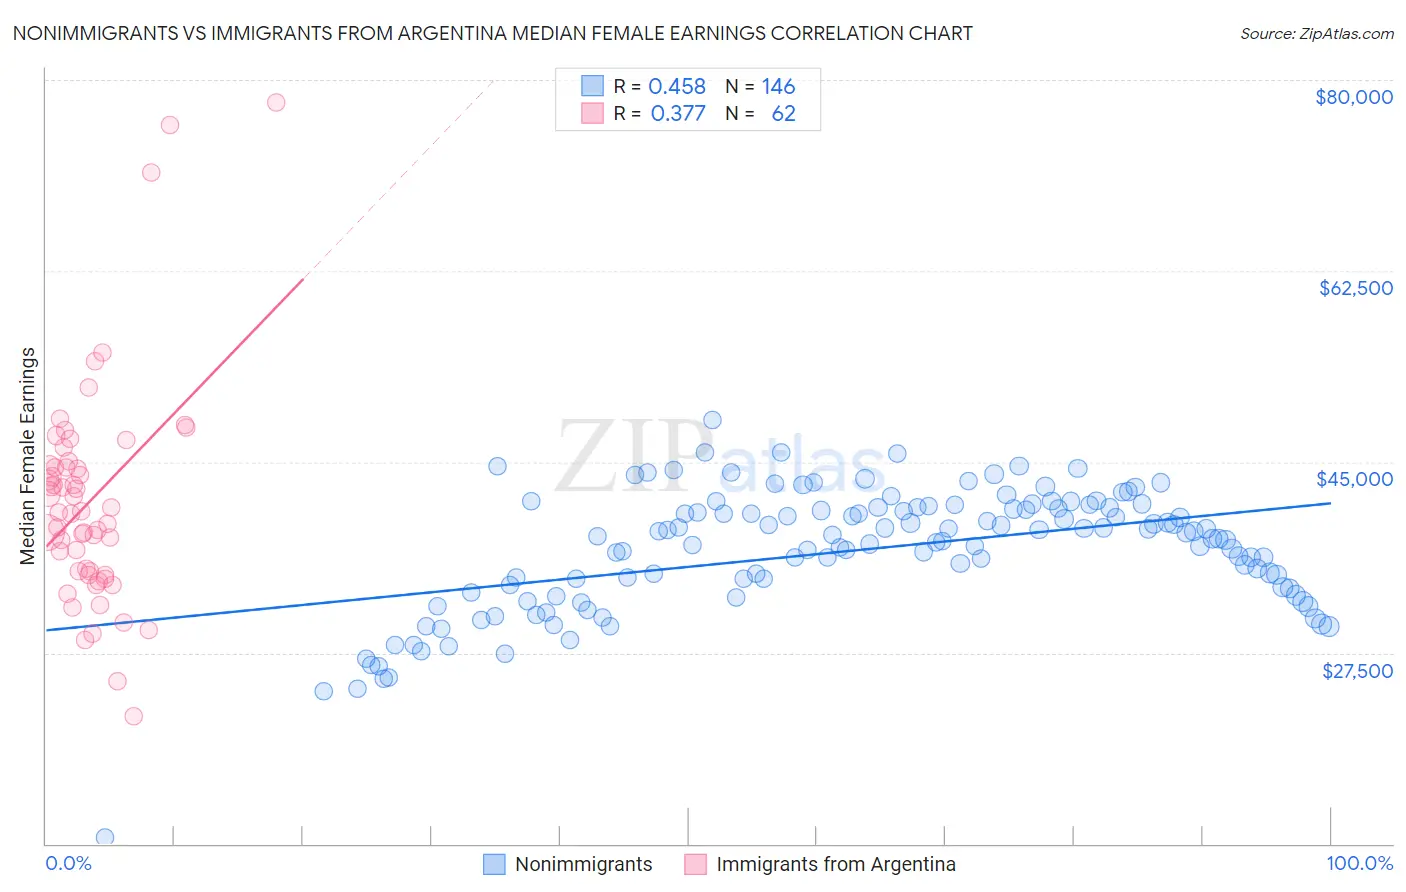
Nonimmigrants vs Immigrants from Argentina Median Female Earnings Correlation Chart
The statistical analysis conducted on geographies consisting of 581,449,824 people shows a moderate positive correlation between the proportion of Nonimmigrants and median female earnings in the United States with a correlation coefficient (R) of 0.458 and weighted average of $37,024. Similarly, the statistical analysis conducted on geographies consisting of 264,373,843 people shows a mild positive correlation between the proportion of Immigrants from Argentina and median female earnings in the United States with a correlation coefficient (R) of 0.377 and weighted average of $41,554, a difference of 12.2%.
Median Female Earnings Correlation Summary
| Measurement | Nonimmigrants | Immigrants from Argentina |
| Minimum | $10,532 | $21,743 |
| Maximum | $48,847 | $77,902 |
| Range | $38,315 | $56,159 |
| Mean | $36,884 | $41,489 |
| Median | $38,067 | $40,427 |
| Interquartile 25% (IQ1) | $33,375 | $34,985 |
| Interquartile 75% (IQ3) | $40,787 | $44,732 |
| Interquartile Range (IQR) | $7,412 | $9,747 |
| Standard Deviation (Sample) | $5,653 | $10,181 |
| Standard Deviation (Population) | $5,634 | $10,099 |
Similar Demographics by Median Female Earnings
Demographics Similar to Nonimmigrants by Median Female Earnings
In terms of median female earnings, the demographic groups most similar to Nonimmigrants are Cree ($37,018, a difference of 0.010%), Dominican ($37,046, a difference of 0.060%), Immigrants from Venezuela ($37,003, a difference of 0.060%), Immigrants from Belize ($37,056, a difference of 0.090%), and Salvadoran ($37,083, a difference of 0.16%).
| Demographics | Rating | Rank | Median Female Earnings |
| Dutch | 0.7 /100 | #260 | Tragic $37,339 |
| Malaysians | 0.7 /100 | #261 | Tragic $37,298 |
| Venezuelans | 0.7 /100 | #262 | Tragic $37,282 |
| German Russians | 0.5 /100 | #263 | Tragic $37,105 |
| Salvadorans | 0.4 /100 | #264 | Tragic $37,083 |
| Immigrants | Belize | 0.4 /100 | #265 | Tragic $37,056 |
| Dominicans | 0.4 /100 | #266 | Tragic $37,046 |
| Immigrants | Nonimmigrants | 0.4 /100 | #267 | Tragic $37,024 |
| Cree | 0.4 /100 | #268 | Tragic $37,018 |
| Immigrants | Venezuela | 0.4 /100 | #269 | Tragic $37,003 |
| French American Indians | 0.3 /100 | #270 | Tragic $36,920 |
| Nicaraguans | 0.3 /100 | #271 | Tragic $36,904 |
| Immigrants | Dominican Republic | 0.3 /100 | #272 | Tragic $36,857 |
| Immigrants | Laos | 0.3 /100 | #273 | Tragic $36,841 |
| Immigrants | El Salvador | 0.2 /100 | #274 | Tragic $36,673 |
Demographics Similar to Immigrants from Argentina by Median Female Earnings
In terms of median female earnings, the demographic groups most similar to Immigrants from Argentina are Immigrants from Zimbabwe ($41,527, a difference of 0.060%), Italian ($41,505, a difference of 0.12%), Immigrants from Eritrea ($41,485, a difference of 0.17%), Palestinian ($41,484, a difference of 0.17%), and Immigrants from Poland ($41,630, a difference of 0.18%).
| Demographics | Rating | Rank | Median Female Earnings |
| South Africans | 98.8 /100 | #96 | Exceptional $41,825 |
| Immigrants | Hungary | 98.8 /100 | #97 | Exceptional $41,820 |
| Immigrants | Scotland | 98.7 /100 | #98 | Exceptional $41,771 |
| Immigrants | Barbados | 98.4 /100 | #99 | Exceptional $41,685 |
| Romanians | 98.3 /100 | #100 | Exceptional $41,663 |
| Immigrants | Fiji | 98.3 /100 | #101 | Exceptional $41,656 |
| Immigrants | Poland | 98.2 /100 | #102 | Exceptional $41,630 |
| Immigrants | Argentina | 97.9 /100 | #103 | Exceptional $41,554 |
| Immigrants | Zimbabwe | 97.8 /100 | #104 | Exceptional $41,527 |
| Italians | 97.7 /100 | #105 | Exceptional $41,505 |
| Immigrants | Eritrea | 97.6 /100 | #106 | Exceptional $41,485 |
| Palestinians | 97.6 /100 | #107 | Exceptional $41,484 |
| Jordanians | 97.5 /100 | #108 | Exceptional $41,464 |
| Chinese | 97.5 /100 | #109 | Exceptional $41,461 |
| Immigrants | Western Asia | 97.0 /100 | #110 | Exceptional $41,375 |