Nonimmigrants vs Immigrants from Eastern Africa Median Female Earnings
COMPARE
Nonimmigrants
Immigrants from Eastern Africa
Median Female Earnings
Median Female Earnings Comparison
Nonimmigrants
Immigrants from Eastern Africa
$37,024
MEDIAN FEMALE EARNINGS
0.4/ 100
METRIC RATING
267th/ 347
METRIC RANK
$40,644
MEDIAN FEMALE EARNINGS
87.7/ 100
METRIC RATING
136th/ 347
METRIC RANK
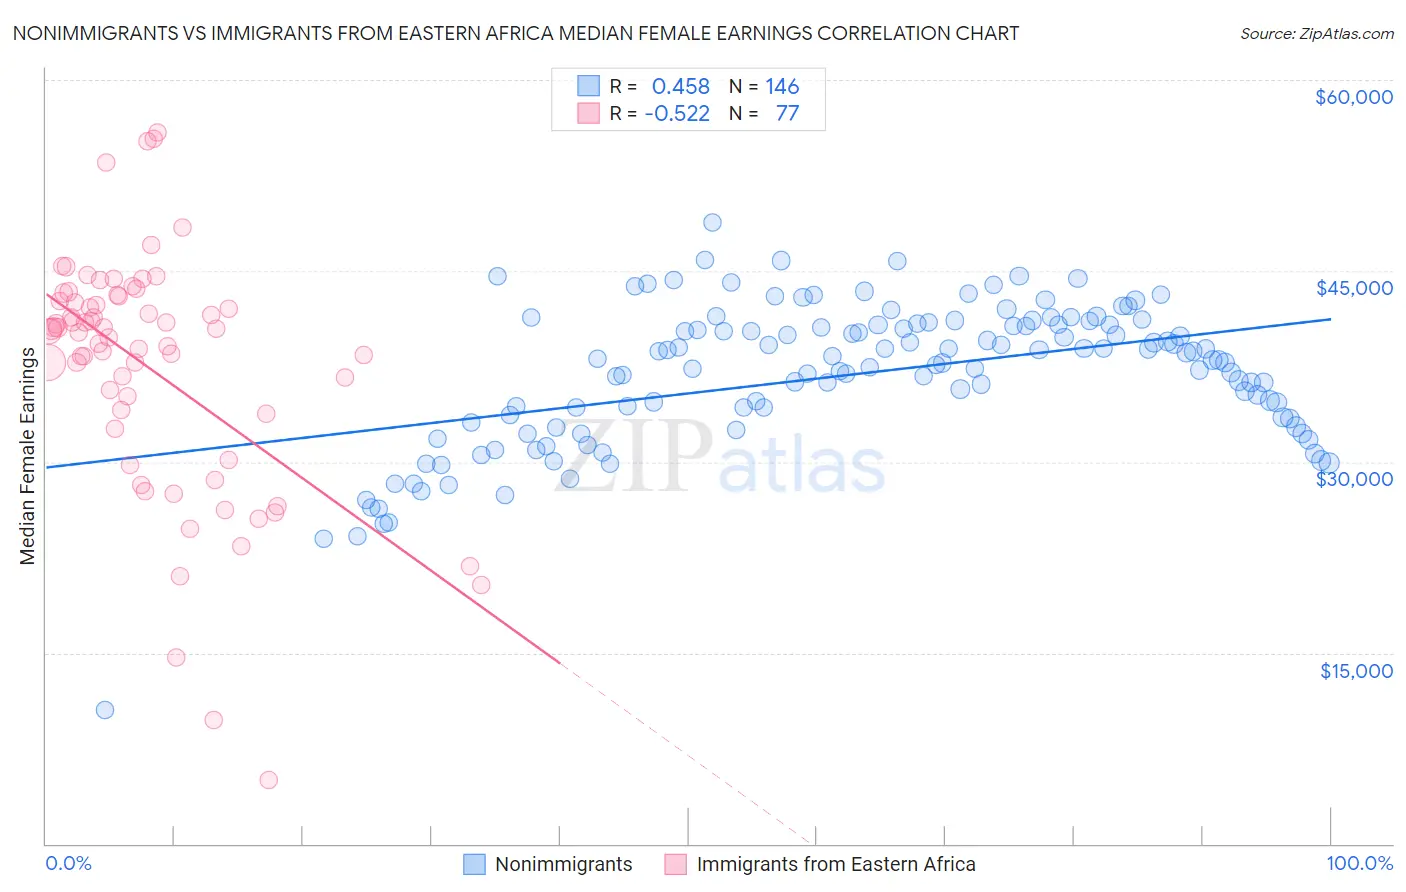
Nonimmigrants vs Immigrants from Eastern Africa Median Female Earnings Correlation Chart
The statistical analysis conducted on geographies consisting of 581,449,824 people shows a moderate positive correlation between the proportion of Nonimmigrants and median female earnings in the United States with a correlation coefficient (R) of 0.458 and weighted average of $37,024. Similarly, the statistical analysis conducted on geographies consisting of 355,081,217 people shows a substantial negative correlation between the proportion of Immigrants from Eastern Africa and median female earnings in the United States with a correlation coefficient (R) of -0.522 and weighted average of $40,644, a difference of 9.8%.
Median Female Earnings Correlation Summary
| Measurement | Nonimmigrants | Immigrants from Eastern Africa |
| Minimum | $10,532 | $5,000 |
| Maximum | $48,847 | $55,898 |
| Range | $38,315 | $50,898 |
| Mean | $36,884 | $37,373 |
| Median | $38,067 | $40,248 |
| Interquartile 25% (IQ1) | $33,375 | $33,197 |
| Interquartile 75% (IQ3) | $40,787 | $42,814 |
| Interquartile Range (IQR) | $7,412 | $9,617 |
| Standard Deviation (Sample) | $5,653 | $9,538 |
| Standard Deviation (Population) | $5,634 | $9,476 |
Similar Demographics by Median Female Earnings
Demographics Similar to Nonimmigrants by Median Female Earnings
In terms of median female earnings, the demographic groups most similar to Nonimmigrants are Cree ($37,018, a difference of 0.010%), Dominican ($37,046, a difference of 0.060%), Immigrants from Venezuela ($37,003, a difference of 0.060%), Immigrants from Belize ($37,056, a difference of 0.090%), and Salvadoran ($37,083, a difference of 0.16%).
| Demographics | Rating | Rank | Median Female Earnings |
| Dutch | 0.7 /100 | #260 | Tragic $37,339 |
| Malaysians | 0.7 /100 | #261 | Tragic $37,298 |
| Venezuelans | 0.7 /100 | #262 | Tragic $37,282 |
| German Russians | 0.5 /100 | #263 | Tragic $37,105 |
| Salvadorans | 0.4 /100 | #264 | Tragic $37,083 |
| Immigrants | Belize | 0.4 /100 | #265 | Tragic $37,056 |
| Dominicans | 0.4 /100 | #266 | Tragic $37,046 |
| Immigrants | Nonimmigrants | 0.4 /100 | #267 | Tragic $37,024 |
| Cree | 0.4 /100 | #268 | Tragic $37,018 |
| Immigrants | Venezuela | 0.4 /100 | #269 | Tragic $37,003 |
| French American Indians | 0.3 /100 | #270 | Tragic $36,920 |
| Nicaraguans | 0.3 /100 | #271 | Tragic $36,904 |
| Immigrants | Dominican Republic | 0.3 /100 | #272 | Tragic $36,857 |
| Immigrants | Laos | 0.3 /100 | #273 | Tragic $36,841 |
| Immigrants | El Salvador | 0.2 /100 | #274 | Tragic $36,673 |
Demographics Similar to Immigrants from Eastern Africa by Median Female Earnings
In terms of median female earnings, the demographic groups most similar to Immigrants from Eastern Africa are Pakistani ($40,596, a difference of 0.12%), Immigrants from Nepal ($40,704, a difference of 0.15%), Taiwanese ($40,576, a difference of 0.17%), Arab ($40,718, a difference of 0.18%), and Syrian ($40,727, a difference of 0.20%).
| Demographics | Rating | Rank | Median Female Earnings |
| Zimbabweans | 90.8 /100 | #129 | Exceptional $40,798 |
| Immigrants | Guyana | 90.3 /100 | #130 | Exceptional $40,773 |
| Chileans | 90.0 /100 | #131 | Exceptional $40,757 |
| Immigrants | Uganda | 89.7 /100 | #132 | Excellent $40,739 |
| Syrians | 89.5 /100 | #133 | Excellent $40,727 |
| Arabs | 89.3 /100 | #134 | Excellent $40,718 |
| Immigrants | Nepal | 89.0 /100 | #135 | Excellent $40,704 |
| Immigrants | Eastern Africa | 87.7 /100 | #136 | Excellent $40,644 |
| Pakistanis | 86.6 /100 | #137 | Excellent $40,596 |
| Taiwanese | 86.1 /100 | #138 | Excellent $40,576 |
| Immigrants | South Eastern Asia | 85.7 /100 | #139 | Excellent $40,558 |
| Serbians | 85.2 /100 | #140 | Excellent $40,539 |
| Immigrants | Syria | 84.1 /100 | #141 | Excellent $40,499 |
| Sri Lankans | 84.0 /100 | #142 | Excellent $40,496 |
| Northern Europeans | 83.9 /100 | #143 | Excellent $40,491 |