Delaware vs Korean Householder Income Under 25 years
COMPARE
Delaware
Korean
Householder Income Under 25 years
Householder Income Under 25 years Comparison
Delaware
Koreans
$47,159
HOUSEHOLDER INCOME UNDER 25 YEARS
0.0/ 100
METRIC RATING
313th/ 347
METRIC RANK
$57,730
HOUSEHOLDER INCOME UNDER 25 YEARS
100.0/ 100
METRIC RATING
15th/ 347
METRIC RANK
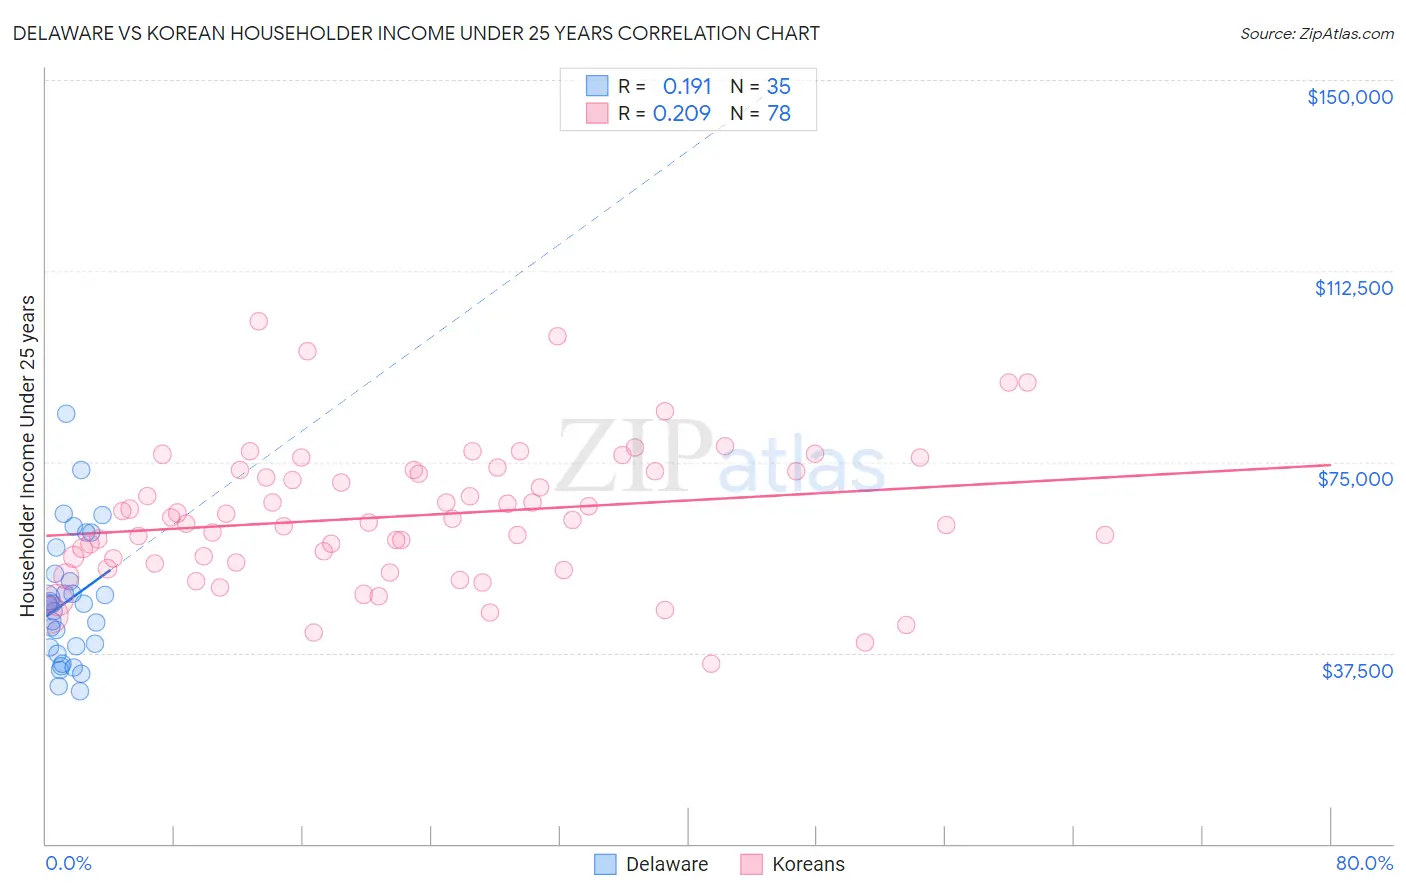
Delaware vs Korean Householder Income Under 25 years Correlation Chart
The statistical analysis conducted on geographies consisting of 88,840,483 people shows a poor positive correlation between the proportion of Delaware and household income with householder under the age of 25 in the United States with a correlation coefficient (R) of 0.191 and weighted average of $47,159. Similarly, the statistical analysis conducted on geographies consisting of 413,031,760 people shows a weak positive correlation between the proportion of Koreans and household income with householder under the age of 25 in the United States with a correlation coefficient (R) of 0.209 and weighted average of $57,730, a difference of 22.4%.
Householder Income Under 25 years Correlation Summary
| Measurement | Delaware | Korean |
| Minimum | $30,000 | $35,240 |
| Maximum | $84,491 | $102,679 |
| Range | $54,491 | $67,439 |
| Mean | $47,740 | $64,423 |
| Median | $47,185 | $63,619 |
| Interquartile 25% (IQ1) | $38,611 | $55,260 |
| Interquartile 75% (IQ3) | $52,932 | $73,277 |
| Interquartile Range (IQR) | $14,321 | $18,017 |
| Standard Deviation (Sample) | $12,436 | $13,448 |
| Standard Deviation (Population) | $12,258 | $13,362 |
Similar Demographics by Householder Income Under 25 years
Demographics Similar to Delaware by Householder Income Under 25 years
In terms of householder income under 25 years, the demographic groups most similar to Delaware are Chippewa ($47,015, a difference of 0.31%), Crow ($47,012, a difference of 0.31%), Sudanese ($46,982, a difference of 0.38%), Hopi ($46,978, a difference of 0.39%), and Bermudan ($47,359, a difference of 0.43%).
| Demographics | Rating | Rank | Householder Income Under 25 years |
| Natives/Alaskans | 0.0 /100 | #306 | Tragic $47,704 |
| Bangladeshis | 0.0 /100 | #307 | Tragic $47,589 |
| Comanche | 0.0 /100 | #308 | Tragic $47,518 |
| U.S. Virgin Islanders | 0.0 /100 | #309 | Tragic $47,448 |
| Iroquois | 0.0 /100 | #310 | Tragic $47,380 |
| Ottawa | 0.0 /100 | #311 | Tragic $47,366 |
| Bermudans | 0.0 /100 | #312 | Tragic $47,359 |
| Delaware | 0.0 /100 | #313 | Tragic $47,159 |
| Chippewa | 0.0 /100 | #314 | Tragic $47,015 |
| Crow | 0.0 /100 | #315 | Tragic $47,012 |
| Sudanese | 0.0 /100 | #316 | Tragic $46,982 |
| Hopi | 0.0 /100 | #317 | Tragic $46,978 |
| Spanish Americans | 0.0 /100 | #318 | Tragic $46,913 |
| Africans | 0.0 /100 | #319 | Tragic $46,838 |
| Immigrants | Sudan | 0.0 /100 | #320 | Tragic $46,791 |
Demographics Similar to Koreans by Householder Income Under 25 years
In terms of householder income under 25 years, the demographic groups most similar to Koreans are Filipino ($57,740, a difference of 0.020%), Immigrants from South Central Asia ($57,818, a difference of 0.15%), Immigrants from China ($57,931, a difference of 0.35%), Immigrants from Philippines ($57,930, a difference of 0.35%), and Immigrants from Afghanistan ($57,478, a difference of 0.44%).
| Demographics | Rating | Rank | Householder Income Under 25 years |
| Indians (Asian) | 100.0 /100 | #8 | Exceptional $58,239 |
| Chinese | 100.0 /100 | #9 | Exceptional $58,162 |
| Afghans | 100.0 /100 | #10 | Exceptional $58,019 |
| Immigrants | China | 100.0 /100 | #11 | Exceptional $57,931 |
| Immigrants | Philippines | 100.0 /100 | #12 | Exceptional $57,930 |
| Immigrants | South Central Asia | 100.0 /100 | #13 | Exceptional $57,818 |
| Filipinos | 100.0 /100 | #14 | Exceptional $57,740 |
| Koreans | 100.0 /100 | #15 | Exceptional $57,730 |
| Immigrants | Afghanistan | 100.0 /100 | #16 | Exceptional $57,478 |
| Sierra Leoneans | 100.0 /100 | #17 | Exceptional $57,272 |
| Immigrants | Eastern Asia | 100.0 /100 | #18 | Exceptional $57,123 |
| Bhutanese | 100.0 /100 | #19 | Exceptional $57,078 |
| Immigrants | Ireland | 100.0 /100 | #20 | Exceptional $57,075 |
| Immigrants | Fiji | 100.0 /100 | #21 | Exceptional $57,074 |
| Asians | 100.0 /100 | #22 | Exceptional $57,003 |