Native/Alaskan vs Pima Householder Income Under 25 years
COMPARE
Native/Alaskan
Pima
Householder Income Under 25 years
Householder Income Under 25 years Comparison
Natives/Alaskans
Pima
$47,704
HOUSEHOLDER INCOME UNDER 25 YEARS
0.0/ 100
METRIC RATING
306th/ 347
METRIC RANK
$51,503
HOUSEHOLDER INCOME UNDER 25 YEARS
15.7/ 100
METRIC RATING
197th/ 347
METRIC RANK
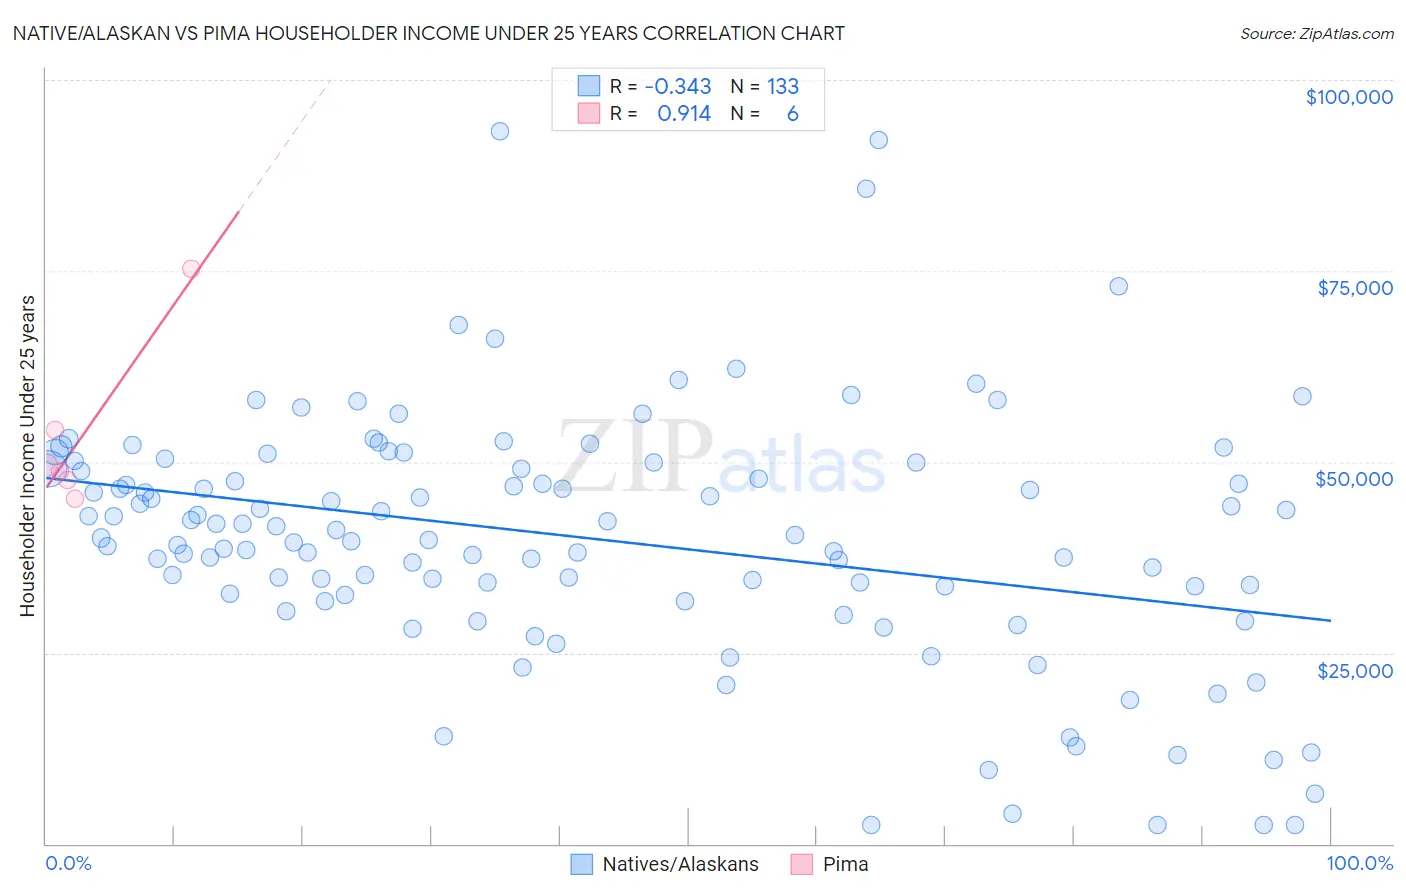
Native/Alaskan vs Pima Householder Income Under 25 years Correlation Chart
The statistical analysis conducted on geographies consisting of 416,135,889 people shows a mild negative correlation between the proportion of Natives/Alaskans and household income with householder under the age of 25 in the United States with a correlation coefficient (R) of -0.343 and weighted average of $47,704. Similarly, the statistical analysis conducted on geographies consisting of 59,375,997 people shows a near-perfect positive correlation between the proportion of Pima and household income with householder under the age of 25 in the United States with a correlation coefficient (R) of 0.914 and weighted average of $51,503, a difference of 8.0%.
Householder Income Under 25 years Correlation Summary
| Measurement | Native/Alaskan | Pima |
| Minimum | $2,499 | $45,215 |
| Maximum | $93,365 | $75,313 |
| Range | $90,866 | $30,098 |
| Mean | $40,011 | $53,455 |
| Median | $40,469 | $49,199 |
| Interquartile 25% (IQ1) | $32,640 | $47,558 |
| Interquartile 75% (IQ3) | $49,547 | $54,244 |
| Interquartile Range (IQR) | $16,907 | $6,685 |
| Standard Deviation (Sample) | $16,339 | $11,115 |
| Standard Deviation (Population) | $16,277 | $10,146 |
Similar Demographics by Householder Income Under 25 years
Demographics Similar to Natives/Alaskans by Householder Income Under 25 years
In terms of householder income under 25 years, the demographic groups most similar to Natives/Alaskans are Bangladeshi ($47,589, a difference of 0.24%), Cherokee ($47,848, a difference of 0.30%), Comanche ($47,518, a difference of 0.39%), Menominee ($47,907, a difference of 0.43%), and Immigrants from Middle Africa ($47,916, a difference of 0.44%).
| Demographics | Rating | Rank | Householder Income Under 25 years |
| Immigrants | Honduras | 0.0 /100 | #299 | Tragic $48,267 |
| Immigrants | Somalia | 0.0 /100 | #300 | Tragic $48,135 |
| Immigrants | Kuwait | 0.0 /100 | #301 | Tragic $48,126 |
| Immigrants | Liberia | 0.0 /100 | #302 | Tragic $47,981 |
| Immigrants | Middle Africa | 0.0 /100 | #303 | Tragic $47,916 |
| Menominee | 0.0 /100 | #304 | Tragic $47,907 |
| Cherokee | 0.0 /100 | #305 | Tragic $47,848 |
| Natives/Alaskans | 0.0 /100 | #306 | Tragic $47,704 |
| Bangladeshis | 0.0 /100 | #307 | Tragic $47,589 |
| Comanche | 0.0 /100 | #308 | Tragic $47,518 |
| U.S. Virgin Islanders | 0.0 /100 | #309 | Tragic $47,448 |
| Iroquois | 0.0 /100 | #310 | Tragic $47,380 |
| Ottawa | 0.0 /100 | #311 | Tragic $47,366 |
| Bermudans | 0.0 /100 | #312 | Tragic $47,359 |
| Delaware | 0.0 /100 | #313 | Tragic $47,159 |
Demographics Similar to Pima by Householder Income Under 25 years
In terms of householder income under 25 years, the demographic groups most similar to Pima are Palestinian ($51,515, a difference of 0.020%), Immigrants from Syria ($51,494, a difference of 0.020%), Swiss ($51,493, a difference of 0.020%), Guatemalan ($51,525, a difference of 0.040%), and Estonian ($51,523, a difference of 0.040%).
| Demographics | Rating | Rank | Householder Income Under 25 years |
| Malaysians | 19.7 /100 | #190 | Poor $51,615 |
| Panamanians | 19.5 /100 | #191 | Poor $51,611 |
| West Indians | 18.5 /100 | #192 | Poor $51,583 |
| Immigrants | Eritrea | 18.1 /100 | #193 | Poor $51,574 |
| Guatemalans | 16.4 /100 | #194 | Poor $51,525 |
| Estonians | 16.4 /100 | #195 | Poor $51,523 |
| Palestinians | 16.1 /100 | #196 | Poor $51,515 |
| Pima | 15.7 /100 | #197 | Poor $51,503 |
| Immigrants | Syria | 15.4 /100 | #198 | Poor $51,494 |
| Swiss | 15.4 /100 | #199 | Poor $51,493 |
| Immigrants | West Indies | 14.9 /100 | #200 | Poor $51,479 |
| British | 14.9 /100 | #201 | Poor $51,477 |
| Immigrants | Guatemala | 14.0 /100 | #202 | Poor $51,447 |
| Immigrants | Cameroon | 13.6 /100 | #203 | Poor $51,433 |
| Czechs | 13.2 /100 | #204 | Poor $51,421 |