Native/Alaskan vs Ethiopian Householder Income Under 25 years
COMPARE
Native/Alaskan
Ethiopian
Householder Income Under 25 years
Householder Income Under 25 years Comparison
Natives/Alaskans
Ethiopians
$47,704
HOUSEHOLDER INCOME UNDER 25 YEARS
0.0/ 100
METRIC RATING
306th/ 347
METRIC RANK
$53,818
HOUSEHOLDER INCOME UNDER 25 YEARS
98.2/ 100
METRIC RATING
104th/ 347
METRIC RANK
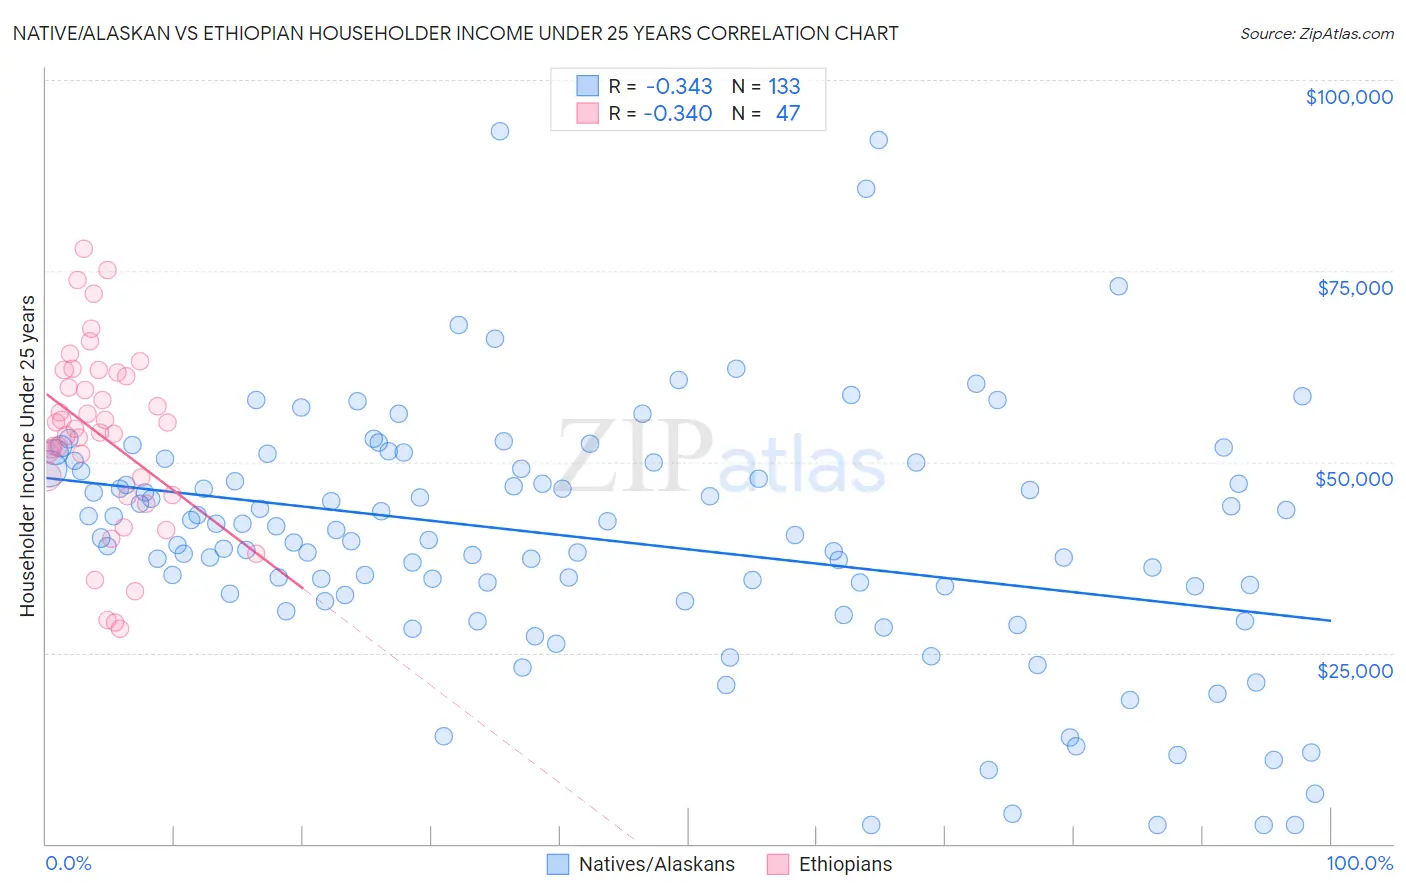
Native/Alaskan vs Ethiopian Householder Income Under 25 years Correlation Chart
The statistical analysis conducted on geographies consisting of 416,135,889 people shows a mild negative correlation between the proportion of Natives/Alaskans and household income with householder under the age of 25 in the United States with a correlation coefficient (R) of -0.343 and weighted average of $47,704. Similarly, the statistical analysis conducted on geographies consisting of 201,530,773 people shows a mild negative correlation between the proportion of Ethiopians and household income with householder under the age of 25 in the United States with a correlation coefficient (R) of -0.340 and weighted average of $53,818, a difference of 12.8%.
Householder Income Under 25 years Correlation Summary
| Measurement | Native/Alaskan | Ethiopian |
| Minimum | $2,499 | $28,125 |
| Maximum | $93,365 | $77,898 |
| Range | $90,866 | $49,773 |
| Mean | $40,011 | $53,404 |
| Median | $40,469 | $54,292 |
| Interquartile 25% (IQ1) | $32,640 | $45,695 |
| Interquartile 75% (IQ3) | $49,547 | $61,784 |
| Interquartile Range (IQR) | $16,907 | $16,089 |
| Standard Deviation (Sample) | $16,339 | $11,871 |
| Standard Deviation (Population) | $16,277 | $11,744 |
Similar Demographics by Householder Income Under 25 years
Demographics Similar to Natives/Alaskans by Householder Income Under 25 years
In terms of householder income under 25 years, the demographic groups most similar to Natives/Alaskans are Bangladeshi ($47,589, a difference of 0.24%), Cherokee ($47,848, a difference of 0.30%), Comanche ($47,518, a difference of 0.39%), Menominee ($47,907, a difference of 0.43%), and Immigrants from Middle Africa ($47,916, a difference of 0.44%).
| Demographics | Rating | Rank | Householder Income Under 25 years |
| Immigrants | Honduras | 0.0 /100 | #299 | Tragic $48,267 |
| Immigrants | Somalia | 0.0 /100 | #300 | Tragic $48,135 |
| Immigrants | Kuwait | 0.0 /100 | #301 | Tragic $48,126 |
| Immigrants | Liberia | 0.0 /100 | #302 | Tragic $47,981 |
| Immigrants | Middle Africa | 0.0 /100 | #303 | Tragic $47,916 |
| Menominee | 0.0 /100 | #304 | Tragic $47,907 |
| Cherokee | 0.0 /100 | #305 | Tragic $47,848 |
| Natives/Alaskans | 0.0 /100 | #306 | Tragic $47,704 |
| Bangladeshis | 0.0 /100 | #307 | Tragic $47,589 |
| Comanche | 0.0 /100 | #308 | Tragic $47,518 |
| U.S. Virgin Islanders | 0.0 /100 | #309 | Tragic $47,448 |
| Iroquois | 0.0 /100 | #310 | Tragic $47,380 |
| Ottawa | 0.0 /100 | #311 | Tragic $47,366 |
| Bermudans | 0.0 /100 | #312 | Tragic $47,359 |
| Delaware | 0.0 /100 | #313 | Tragic $47,159 |
Demographics Similar to Ethiopians by Householder Income Under 25 years
In terms of householder income under 25 years, the demographic groups most similar to Ethiopians are Immigrants from France ($53,805, a difference of 0.020%), Ukrainian ($53,843, a difference of 0.050%), Albanian ($53,794, a difference of 0.050%), Australian ($53,739, a difference of 0.15%), and Maltese ($53,735, a difference of 0.15%).
| Demographics | Rating | Rank | Householder Income Under 25 years |
| Immigrants | Portugal | 99.1 /100 | #97 | Exceptional $54,105 |
| Eastern Europeans | 99.0 /100 | #98 | Exceptional $54,066 |
| Alaska Natives | 98.8 /100 | #99 | Exceptional $54,000 |
| Immigrants | Kazakhstan | 98.8 /100 | #100 | Exceptional $53,990 |
| South Americans | 98.6 /100 | #101 | Exceptional $53,939 |
| Ecuadorians | 98.5 /100 | #102 | Exceptional $53,911 |
| Ukrainians | 98.3 /100 | #103 | Exceptional $53,843 |
| Ethiopians | 98.2 /100 | #104 | Exceptional $53,818 |
| Immigrants | France | 98.1 /100 | #105 | Exceptional $53,805 |
| Albanians | 98.1 /100 | #106 | Exceptional $53,794 |
| Australians | 97.8 /100 | #107 | Exceptional $53,739 |
| Maltese | 97.8 /100 | #108 | Exceptional $53,735 |
| Immigrants | Ecuador | 97.7 /100 | #109 | Exceptional $53,722 |
| Greeks | 97.7 /100 | #110 | Exceptional $53,715 |
| Immigrants | Colombia | 97.7 /100 | #111 | Exceptional $53,714 |