Scotch-Irish vs Korean Householder Income Under 25 years
COMPARE
Scotch-Irish
Korean
Householder Income Under 25 years
Householder Income Under 25 years Comparison
Scotch-Irish
Koreans
$49,039
HOUSEHOLDER INCOME UNDER 25 YEARS
0.0/ 100
METRIC RATING
285th/ 347
METRIC RANK
$57,730
HOUSEHOLDER INCOME UNDER 25 YEARS
100.0/ 100
METRIC RATING
15th/ 347
METRIC RANK
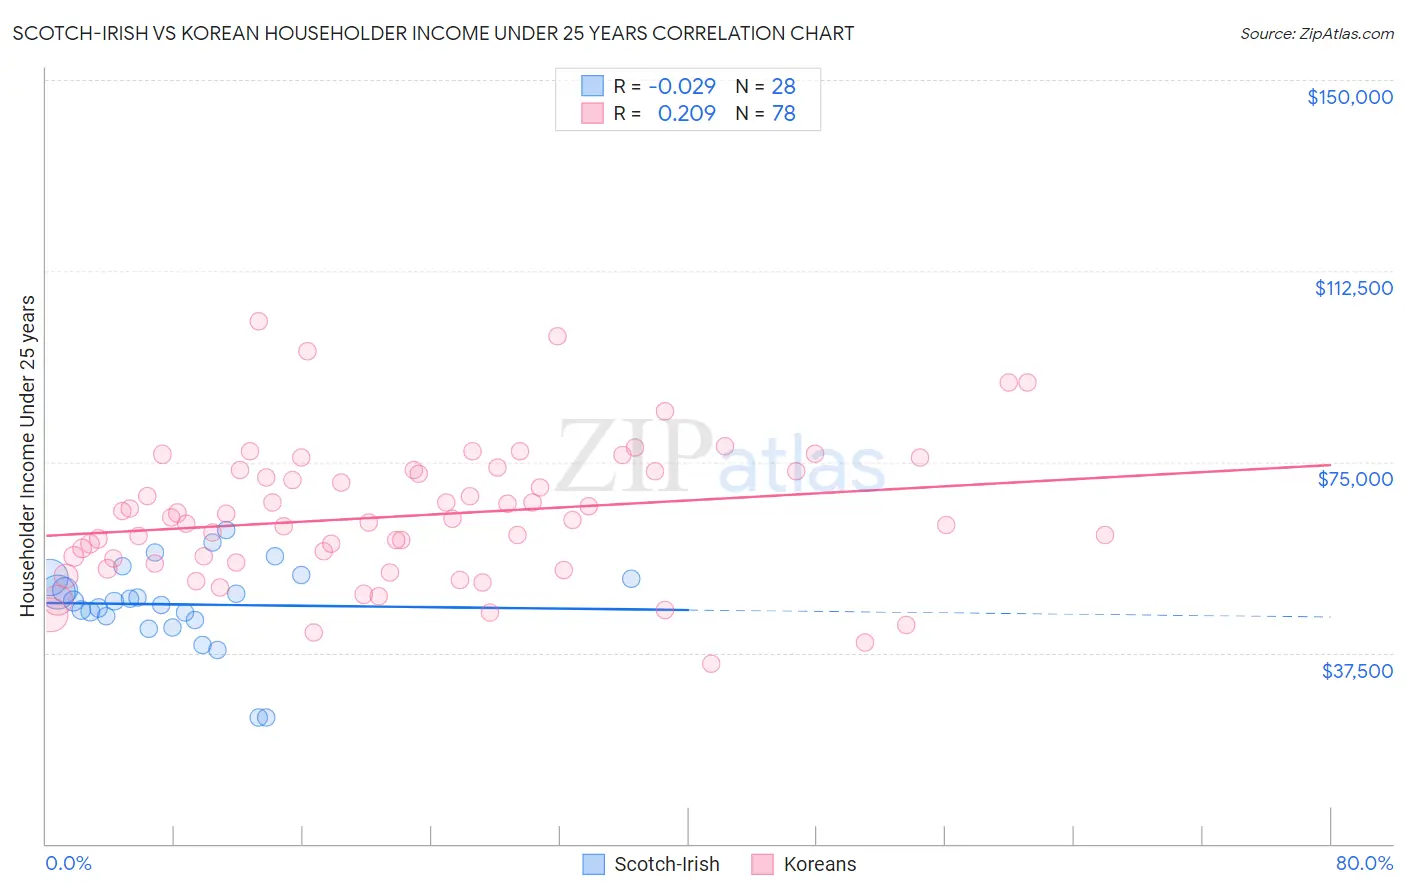
Scotch-Irish vs Korean Householder Income Under 25 years Correlation Chart
The statistical analysis conducted on geographies consisting of 427,674,236 people shows no correlation between the proportion of Scotch-Irish and household income with householder under the age of 25 in the United States with a correlation coefficient (R) of -0.029 and weighted average of $49,039. Similarly, the statistical analysis conducted on geographies consisting of 413,031,760 people shows a weak positive correlation between the proportion of Koreans and household income with householder under the age of 25 in the United States with a correlation coefficient (R) of 0.209 and weighted average of $57,730, a difference of 17.7%.
Householder Income Under 25 years Correlation Summary
| Measurement | Scotch-Irish | Korean |
| Minimum | $24,821 | $35,240 |
| Maximum | $61,601 | $102,679 |
| Range | $36,780 | $67,439 |
| Mean | $47,004 | $64,423 |
| Median | $47,645 | $63,619 |
| Interquartile 25% (IQ1) | $44,331 | $55,260 |
| Interquartile 75% (IQ3) | $52,103 | $73,277 |
| Interquartile Range (IQR) | $7,772 | $18,017 |
| Standard Deviation (Sample) | $8,411 | $13,448 |
| Standard Deviation (Population) | $8,259 | $13,362 |
Similar Demographics by Householder Income Under 25 years
Demographics Similar to Scotch-Irish by Householder Income Under 25 years
In terms of householder income under 25 years, the demographic groups most similar to Scotch-Irish are French American Indian ($48,977, a difference of 0.13%), Carpatho Rusyn ($49,113, a difference of 0.15%), Senegalese ($48,953, a difference of 0.18%), Liberian ($48,917, a difference of 0.25%), and Immigrants from Nigeria ($49,174, a difference of 0.28%).
| Demographics | Rating | Rank | Householder Income Under 25 years |
| Nigerians | 0.1 /100 | #278 | Tragic $49,416 |
| Apache | 0.1 /100 | #279 | Tragic $49,395 |
| Hmong | 0.1 /100 | #280 | Tragic $49,364 |
| Immigrants | Nonimmigrants | 0.1 /100 | #281 | Tragic $49,348 |
| Alsatians | 0.1 /100 | #282 | Tragic $49,267 |
| Immigrants | Nigeria | 0.1 /100 | #283 | Tragic $49,174 |
| Carpatho Rusyns | 0.1 /100 | #284 | Tragic $49,113 |
| Scotch-Irish | 0.0 /100 | #285 | Tragic $49,039 |
| French American Indians | 0.0 /100 | #286 | Tragic $48,977 |
| Senegalese | 0.0 /100 | #287 | Tragic $48,953 |
| Liberians | 0.0 /100 | #288 | Tragic $48,917 |
| Hondurans | 0.0 /100 | #289 | Tragic $48,885 |
| Americans | 0.0 /100 | #290 | Tragic $48,860 |
| Immigrants | Burma/Myanmar | 0.0 /100 | #291 | Tragic $48,749 |
| Shoshone | 0.0 /100 | #292 | Tragic $48,720 |
Demographics Similar to Koreans by Householder Income Under 25 years
In terms of householder income under 25 years, the demographic groups most similar to Koreans are Filipino ($57,740, a difference of 0.020%), Immigrants from South Central Asia ($57,818, a difference of 0.15%), Immigrants from China ($57,931, a difference of 0.35%), Immigrants from Philippines ($57,930, a difference of 0.35%), and Immigrants from Afghanistan ($57,478, a difference of 0.44%).
| Demographics | Rating | Rank | Householder Income Under 25 years |
| Indians (Asian) | 100.0 /100 | #8 | Exceptional $58,239 |
| Chinese | 100.0 /100 | #9 | Exceptional $58,162 |
| Afghans | 100.0 /100 | #10 | Exceptional $58,019 |
| Immigrants | China | 100.0 /100 | #11 | Exceptional $57,931 |
| Immigrants | Philippines | 100.0 /100 | #12 | Exceptional $57,930 |
| Immigrants | South Central Asia | 100.0 /100 | #13 | Exceptional $57,818 |
| Filipinos | 100.0 /100 | #14 | Exceptional $57,740 |
| Koreans | 100.0 /100 | #15 | Exceptional $57,730 |
| Immigrants | Afghanistan | 100.0 /100 | #16 | Exceptional $57,478 |
| Sierra Leoneans | 100.0 /100 | #17 | Exceptional $57,272 |
| Immigrants | Eastern Asia | 100.0 /100 | #18 | Exceptional $57,123 |
| Bhutanese | 100.0 /100 | #19 | Exceptional $57,078 |
| Immigrants | Ireland | 100.0 /100 | #20 | Exceptional $57,075 |
| Immigrants | Fiji | 100.0 /100 | #21 | Exceptional $57,074 |
| Asians | 100.0 /100 | #22 | Exceptional $57,003 |