Native/Alaskan vs Chickasaw Householder Income Under 25 years
COMPARE
Native/Alaskan
Chickasaw
Householder Income Under 25 years
Householder Income Under 25 years Comparison
Natives/Alaskans
Chickasaw
$47,704
HOUSEHOLDER INCOME UNDER 25 YEARS
0.0/ 100
METRIC RATING
306th/ 347
METRIC RANK
$44,763
HOUSEHOLDER INCOME UNDER 25 YEARS
0.0/ 100
METRIC RATING
338th/ 347
METRIC RANK
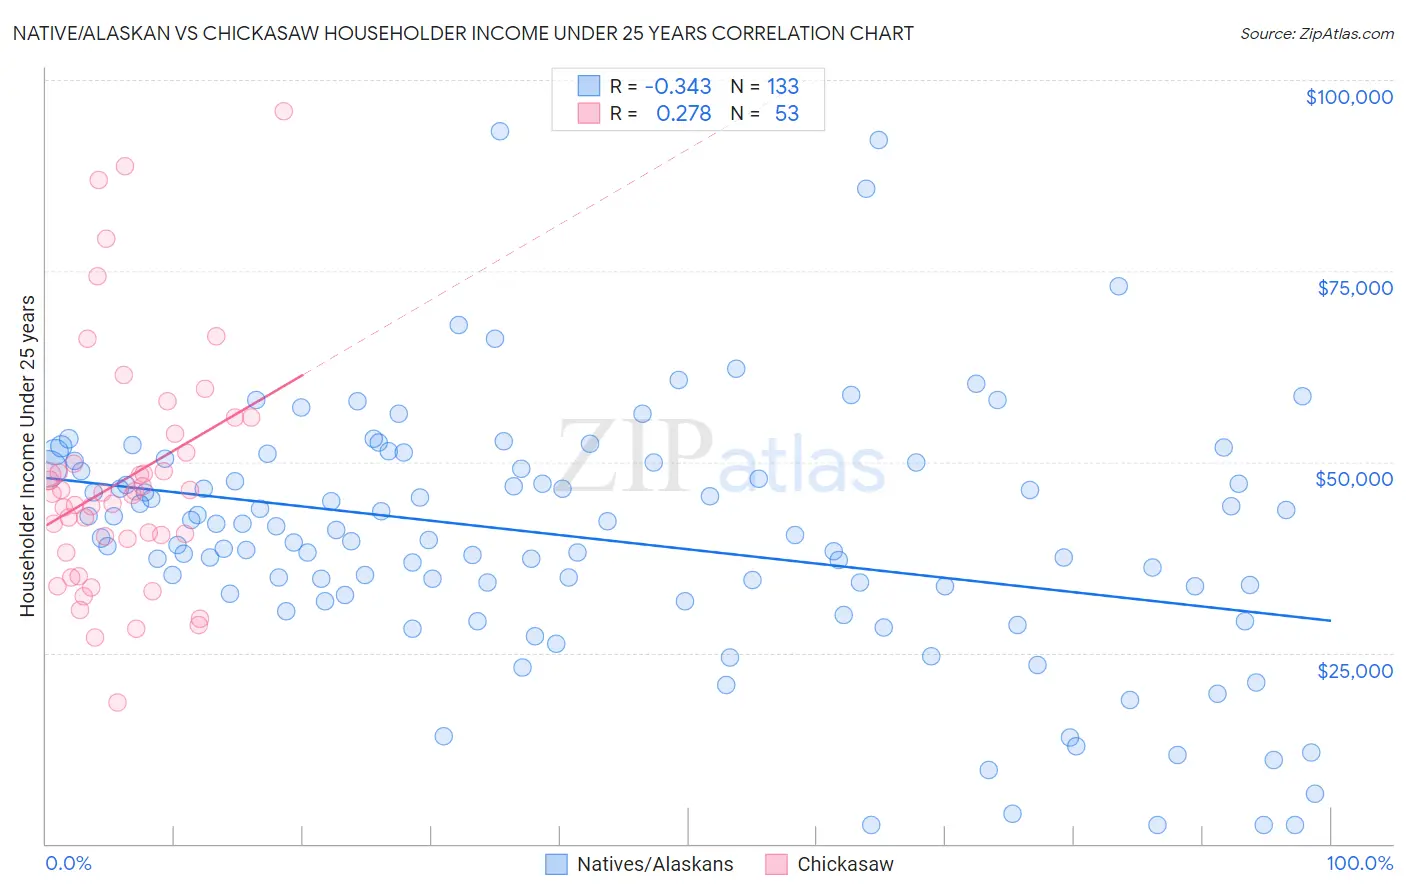
Native/Alaskan vs Chickasaw Householder Income Under 25 years Correlation Chart
The statistical analysis conducted on geographies consisting of 416,135,889 people shows a mild negative correlation between the proportion of Natives/Alaskans and household income with householder under the age of 25 in the United States with a correlation coefficient (R) of -0.343 and weighted average of $47,704. Similarly, the statistical analysis conducted on geographies consisting of 137,295,377 people shows a weak positive correlation between the proportion of Chickasaw and household income with householder under the age of 25 in the United States with a correlation coefficient (R) of 0.278 and weighted average of $44,763, a difference of 6.6%.
Householder Income Under 25 years Correlation Summary
| Measurement | Native/Alaskan | Chickasaw |
| Minimum | $2,499 | $18,415 |
| Maximum | $93,365 | $95,833 |
| Range | $90,866 | $77,418 |
| Mean | $40,011 | $47,638 |
| Median | $40,469 | $45,852 |
| Interquartile 25% (IQ1) | $32,640 | $38,980 |
| Interquartile 75% (IQ3) | $49,547 | $52,456 |
| Interquartile Range (IQR) | $16,907 | $13,476 |
| Standard Deviation (Sample) | $16,339 | $15,738 |
| Standard Deviation (Population) | $16,277 | $15,588 |
Similar Demographics by Householder Income Under 25 years
Demographics Similar to Natives/Alaskans by Householder Income Under 25 years
In terms of householder income under 25 years, the demographic groups most similar to Natives/Alaskans are Bangladeshi ($47,589, a difference of 0.24%), Cherokee ($47,848, a difference of 0.30%), Comanche ($47,518, a difference of 0.39%), Menominee ($47,907, a difference of 0.43%), and Immigrants from Middle Africa ($47,916, a difference of 0.44%).
| Demographics | Rating | Rank | Householder Income Under 25 years |
| Immigrants | Honduras | 0.0 /100 | #299 | Tragic $48,267 |
| Immigrants | Somalia | 0.0 /100 | #300 | Tragic $48,135 |
| Immigrants | Kuwait | 0.0 /100 | #301 | Tragic $48,126 |
| Immigrants | Liberia | 0.0 /100 | #302 | Tragic $47,981 |
| Immigrants | Middle Africa | 0.0 /100 | #303 | Tragic $47,916 |
| Menominee | 0.0 /100 | #304 | Tragic $47,907 |
| Cherokee | 0.0 /100 | #305 | Tragic $47,848 |
| Natives/Alaskans | 0.0 /100 | #306 | Tragic $47,704 |
| Bangladeshis | 0.0 /100 | #307 | Tragic $47,589 |
| Comanche | 0.0 /100 | #308 | Tragic $47,518 |
| U.S. Virgin Islanders | 0.0 /100 | #309 | Tragic $47,448 |
| Iroquois | 0.0 /100 | #310 | Tragic $47,380 |
| Ottawa | 0.0 /100 | #311 | Tragic $47,366 |
| Bermudans | 0.0 /100 | #312 | Tragic $47,359 |
| Delaware | 0.0 /100 | #313 | Tragic $47,159 |
Demographics Similar to Chickasaw by Householder Income Under 25 years
In terms of householder income under 25 years, the demographic groups most similar to Chickasaw are Kiowa ($44,733, a difference of 0.070%), Pueblo ($45,018, a difference of 0.57%), Black/African American ($44,381, a difference of 0.86%), Houma ($44,356, a difference of 0.92%), and Tohono O'odham ($45,248, a difference of 1.1%).
| Demographics | Rating | Rank | Householder Income Under 25 years |
| Immigrants | Zaire | 0.0 /100 | #331 | Tragic $45,529 |
| Choctaw | 0.0 /100 | #332 | Tragic $45,450 |
| Creek | 0.0 /100 | #333 | Tragic $45,371 |
| Cajuns | 0.0 /100 | #334 | Tragic $45,338 |
| Cheyenne | 0.0 /100 | #335 | Tragic $45,275 |
| Tohono O'odham | 0.0 /100 | #336 | Tragic $45,248 |
| Pueblo | 0.0 /100 | #337 | Tragic $45,018 |
| Chickasaw | 0.0 /100 | #338 | Tragic $44,763 |
| Kiowa | 0.0 /100 | #339 | Tragic $44,733 |
| Blacks/African Americans | 0.0 /100 | #340 | Tragic $44,381 |
| Houma | 0.0 /100 | #341 | Tragic $44,356 |
| Arapaho | 0.0 /100 | #342 | Tragic $44,003 |
| Immigrants | Yemen | 0.0 /100 | #343 | Tragic $43,591 |
| Immigrants | Congo | 0.0 /100 | #344 | Tragic $43,266 |
| Navajo | 0.0 /100 | #345 | Tragic $42,380 |