Native/Alaskan vs Polish Householder Income Under 25 years
COMPARE
Native/Alaskan
Polish
Householder Income Under 25 years
Householder Income Under 25 years Comparison
Natives/Alaskans
Poles
$47,704
HOUSEHOLDER INCOME UNDER 25 YEARS
0.0/ 100
METRIC RATING
306th/ 347
METRIC RANK
$52,407
HOUSEHOLDER INCOME UNDER 25 YEARS
63.0/ 100
METRIC RATING
165th/ 347
METRIC RANK
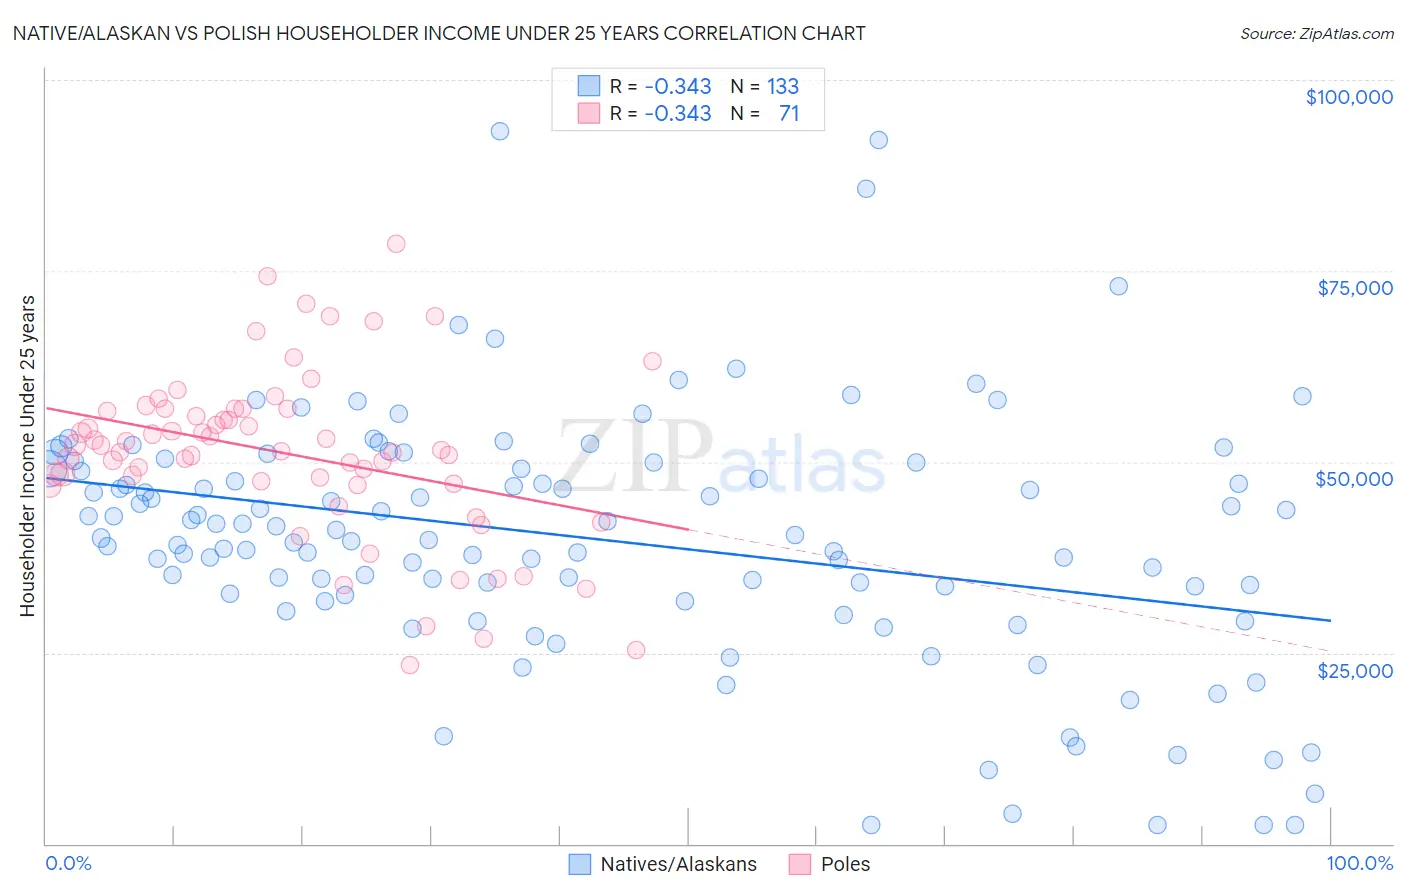
Native/Alaskan vs Polish Householder Income Under 25 years Correlation Chart
The statistical analysis conducted on geographies consisting of 416,135,889 people shows a mild negative correlation between the proportion of Natives/Alaskans and household income with householder under the age of 25 in the United States with a correlation coefficient (R) of -0.343 and weighted average of $47,704. Similarly, the statistical analysis conducted on geographies consisting of 433,901,695 people shows a mild negative correlation between the proportion of Poles and household income with householder under the age of 25 in the United States with a correlation coefficient (R) of -0.343 and weighted average of $52,407, a difference of 9.9%.
Householder Income Under 25 years Correlation Summary
| Measurement | Native/Alaskan | Polish |
| Minimum | $2,499 | $23,462 |
| Maximum | $93,365 | $78,571 |
| Range | $90,866 | $55,109 |
| Mean | $40,011 | $51,111 |
| Median | $40,469 | $51,592 |
| Interquartile 25% (IQ1) | $32,640 | $47,153 |
| Interquartile 75% (IQ3) | $49,547 | $56,895 |
| Interquartile Range (IQR) | $16,907 | $9,742 |
| Standard Deviation (Sample) | $16,339 | $10,979 |
| Standard Deviation (Population) | $16,277 | $10,902 |
Similar Demographics by Householder Income Under 25 years
Demographics Similar to Natives/Alaskans by Householder Income Under 25 years
In terms of householder income under 25 years, the demographic groups most similar to Natives/Alaskans are Bangladeshi ($47,589, a difference of 0.24%), Cherokee ($47,848, a difference of 0.30%), Comanche ($47,518, a difference of 0.39%), Menominee ($47,907, a difference of 0.43%), and Immigrants from Middle Africa ($47,916, a difference of 0.44%).
| Demographics | Rating | Rank | Householder Income Under 25 years |
| Immigrants | Honduras | 0.0 /100 | #299 | Tragic $48,267 |
| Immigrants | Somalia | 0.0 /100 | #300 | Tragic $48,135 |
| Immigrants | Kuwait | 0.0 /100 | #301 | Tragic $48,126 |
| Immigrants | Liberia | 0.0 /100 | #302 | Tragic $47,981 |
| Immigrants | Middle Africa | 0.0 /100 | #303 | Tragic $47,916 |
| Menominee | 0.0 /100 | #304 | Tragic $47,907 |
| Cherokee | 0.0 /100 | #305 | Tragic $47,848 |
| Natives/Alaskans | 0.0 /100 | #306 | Tragic $47,704 |
| Bangladeshis | 0.0 /100 | #307 | Tragic $47,589 |
| Comanche | 0.0 /100 | #308 | Tragic $47,518 |
| U.S. Virgin Islanders | 0.0 /100 | #309 | Tragic $47,448 |
| Iroquois | 0.0 /100 | #310 | Tragic $47,380 |
| Ottawa | 0.0 /100 | #311 | Tragic $47,366 |
| Bermudans | 0.0 /100 | #312 | Tragic $47,359 |
| Delaware | 0.0 /100 | #313 | Tragic $47,159 |
Demographics Similar to Poles by Householder Income Under 25 years
In terms of householder income under 25 years, the demographic groups most similar to Poles are Immigrants from Austria ($52,400, a difference of 0.010%), Immigrants from Chile ($52,440, a difference of 0.060%), Immigrants from Trinidad and Tobago ($52,437, a difference of 0.060%), Immigrants from Uganda ($52,374, a difference of 0.060%), and Immigrants from Cambodia ($52,450, a difference of 0.080%).
| Demographics | Rating | Rank | Householder Income Under 25 years |
| Immigrants | Netherlands | 72.8 /100 | #158 | Good $52,592 |
| Mongolians | 70.2 /100 | #159 | Good $52,540 |
| Immigrants | Turkey | 68.3 /100 | #160 | Good $52,503 |
| Uruguayans | 66.2 /100 | #161 | Good $52,465 |
| Immigrants | Cambodia | 65.4 /100 | #162 | Good $52,450 |
| Immigrants | Chile | 64.8 /100 | #163 | Good $52,440 |
| Immigrants | Trinidad and Tobago | 64.7 /100 | #164 | Good $52,437 |
| Poles | 63.0 /100 | #165 | Good $52,407 |
| Immigrants | Austria | 62.6 /100 | #166 | Good $52,400 |
| Immigrants | Uganda | 61.1 /100 | #167 | Good $52,374 |
| Japanese | 60.5 /100 | #168 | Good $52,365 |
| Canadians | 58.8 /100 | #169 | Average $52,336 |
| Israelis | 58.8 /100 | #170 | Average $52,335 |
| Immigrants | Uruguay | 56.8 /100 | #171 | Average $52,302 |
| Cypriots | 51.2 /100 | #172 | Average $52,209 |