Native/Alaskan vs Vietnamese Householder Income Under 25 years
COMPARE
Native/Alaskan
Vietnamese
Householder Income Under 25 years
Householder Income Under 25 years Comparison
Natives/Alaskans
Vietnamese
$47,704
HOUSEHOLDER INCOME UNDER 25 YEARS
0.0/ 100
METRIC RATING
306th/ 347
METRIC RANK
$56,127
HOUSEHOLDER INCOME UNDER 25 YEARS
100.0/ 100
METRIC RATING
31st/ 347
METRIC RANK
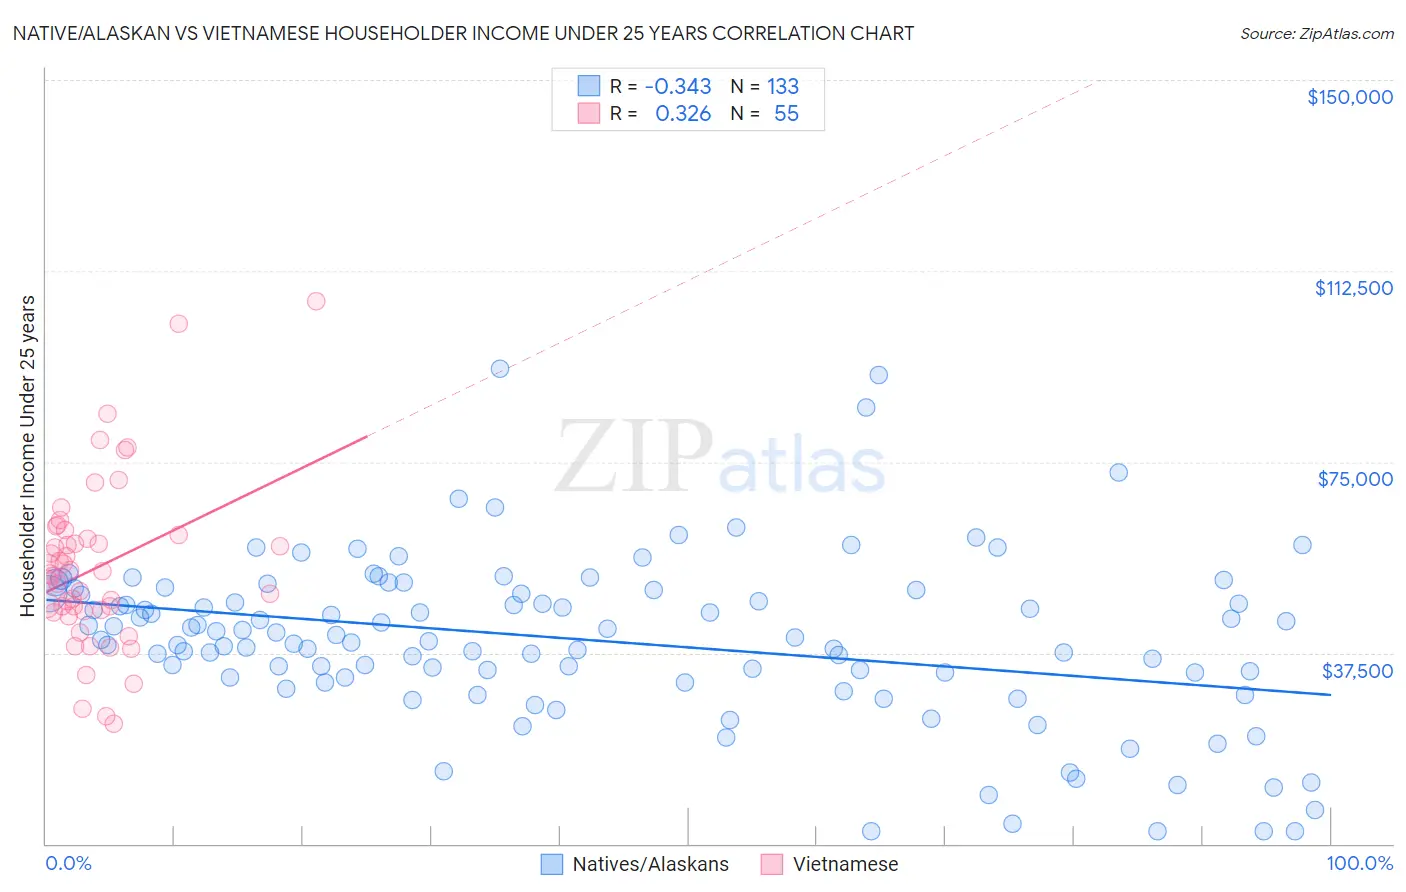
Native/Alaskan vs Vietnamese Householder Income Under 25 years Correlation Chart
The statistical analysis conducted on geographies consisting of 416,135,889 people shows a mild negative correlation between the proportion of Natives/Alaskans and household income with householder under the age of 25 in the United States with a correlation coefficient (R) of -0.343 and weighted average of $47,704. Similarly, the statistical analysis conducted on geographies consisting of 155,350,861 people shows a mild positive correlation between the proportion of Vietnamese and household income with householder under the age of 25 in the United States with a correlation coefficient (R) of 0.326 and weighted average of $56,127, a difference of 17.6%.
Householder Income Under 25 years Correlation Summary
| Measurement | Native/Alaskan | Vietnamese |
| Minimum | $2,499 | $23,560 |
| Maximum | $93,365 | $106,635 |
| Range | $90,866 | $83,075 |
| Mean | $40,011 | $54,213 |
| Median | $40,469 | $52,933 |
| Interquartile 25% (IQ1) | $32,640 | $45,658 |
| Interquartile 75% (IQ3) | $49,547 | $60,617 |
| Interquartile Range (IQR) | $16,907 | $14,959 |
| Standard Deviation (Sample) | $16,339 | $16,342 |
| Standard Deviation (Population) | $16,277 | $16,193 |
Similar Demographics by Householder Income Under 25 years
Demographics Similar to Natives/Alaskans by Householder Income Under 25 years
In terms of householder income under 25 years, the demographic groups most similar to Natives/Alaskans are Bangladeshi ($47,589, a difference of 0.24%), Cherokee ($47,848, a difference of 0.30%), Comanche ($47,518, a difference of 0.39%), Menominee ($47,907, a difference of 0.43%), and Immigrants from Middle Africa ($47,916, a difference of 0.44%).
| Demographics | Rating | Rank | Householder Income Under 25 years |
| Immigrants | Honduras | 0.0 /100 | #299 | Tragic $48,267 |
| Immigrants | Somalia | 0.0 /100 | #300 | Tragic $48,135 |
| Immigrants | Kuwait | 0.0 /100 | #301 | Tragic $48,126 |
| Immigrants | Liberia | 0.0 /100 | #302 | Tragic $47,981 |
| Immigrants | Middle Africa | 0.0 /100 | #303 | Tragic $47,916 |
| Menominee | 0.0 /100 | #304 | Tragic $47,907 |
| Cherokee | 0.0 /100 | #305 | Tragic $47,848 |
| Natives/Alaskans | 0.0 /100 | #306 | Tragic $47,704 |
| Bangladeshis | 0.0 /100 | #307 | Tragic $47,589 |
| Comanche | 0.0 /100 | #308 | Tragic $47,518 |
| U.S. Virgin Islanders | 0.0 /100 | #309 | Tragic $47,448 |
| Iroquois | 0.0 /100 | #310 | Tragic $47,380 |
| Ottawa | 0.0 /100 | #311 | Tragic $47,366 |
| Bermudans | 0.0 /100 | #312 | Tragic $47,359 |
| Delaware | 0.0 /100 | #313 | Tragic $47,159 |
Demographics Similar to Vietnamese by Householder Income Under 25 years
In terms of householder income under 25 years, the demographic groups most similar to Vietnamese are Immigrants from Moldova ($56,168, a difference of 0.070%), Peruvian ($56,052, a difference of 0.13%), Inupiat ($55,935, a difference of 0.34%), Immigrants from Japan ($55,932, a difference of 0.35%), and Tlingit-Haida ($55,914, a difference of 0.38%).
| Demographics | Rating | Rank | Householder Income Under 25 years |
| Immigrants | Singapore | 100.0 /100 | #24 | Exceptional $56,835 |
| Immigrants | Pakistan | 100.0 /100 | #25 | Exceptional $56,789 |
| Immigrants | Australia | 100.0 /100 | #26 | Exceptional $56,660 |
| Immigrants | North Macedonia | 100.0 /100 | #27 | Exceptional $56,503 |
| Immigrants | Peru | 100.0 /100 | #28 | Exceptional $56,384 |
| Immigrants | Asia | 100.0 /100 | #29 | Exceptional $56,379 |
| Immigrants | Moldova | 100.0 /100 | #30 | Exceptional $56,168 |
| Vietnamese | 100.0 /100 | #31 | Exceptional $56,127 |
| Peruvians | 100.0 /100 | #32 | Exceptional $56,052 |
| Inupiat | 100.0 /100 | #33 | Exceptional $55,935 |
| Immigrants | Japan | 100.0 /100 | #34 | Exceptional $55,932 |
| Tlingit-Haida | 100.0 /100 | #35 | Exceptional $55,914 |
| Immigrants | Israel | 100.0 /100 | #36 | Exceptional $55,913 |
| Immigrants | Russia | 100.0 /100 | #37 | Exceptional $55,891 |
| Immigrants | Iran | 100.0 /100 | #38 | Exceptional $55,880 |