Haitian vs Belgian Householder Income Under 25 years
COMPARE
Haitian
Belgian
Householder Income Under 25 years
Householder Income Under 25 years Comparison
Haitians
Belgians
$50,231
HOUSEHOLDER INCOME UNDER 25 YEARS
0.8/ 100
METRIC RATING
262nd/ 347
METRIC RANK
$50,113
HOUSEHOLDER INCOME UNDER 25 YEARS
0.6/ 100
METRIC RATING
265th/ 347
METRIC RANK
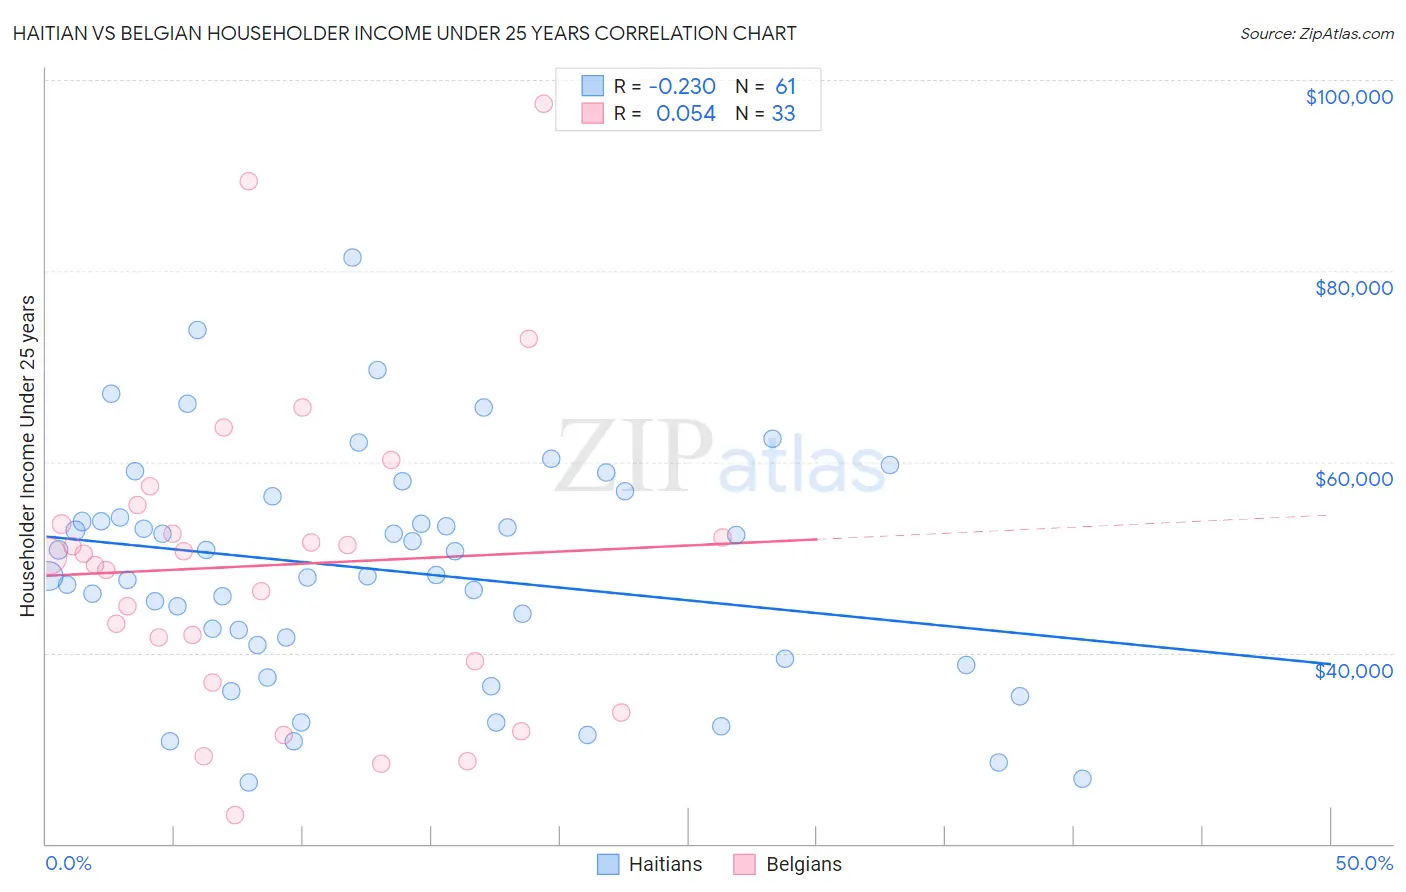
Haitian vs Belgian Householder Income Under 25 years Correlation Chart
The statistical analysis conducted on geographies consisting of 247,862,749 people shows a weak negative correlation between the proportion of Haitians and household income with householder under the age of 25 in the United States with a correlation coefficient (R) of -0.230 and weighted average of $50,231. Similarly, the statistical analysis conducted on geographies consisting of 302,930,390 people shows a slight positive correlation between the proportion of Belgians and household income with householder under the age of 25 in the United States with a correlation coefficient (R) of 0.054 and weighted average of $50,113, a difference of 0.24%.
Householder Income Under 25 years Correlation Summary
| Measurement | Haitian | Belgian |
| Minimum | $26,478 | $22,948 |
| Maximum | $81,415 | $97,500 |
| Range | $54,938 | $74,552 |
| Mean | $48,683 | $49,189 |
| Median | $48,098 | $50,156 |
| Interquartile 25% (IQ1) | $40,094 | $38,023 |
| Interquartile 75% (IQ3) | $55,303 | $54,461 |
| Interquartile Range (IQR) | $15,209 | $16,438 |
| Standard Deviation (Sample) | $11,920 | $16,294 |
| Standard Deviation (Population) | $11,822 | $16,045 |
Demographics Similar to Haitians and Belgians by Householder Income Under 25 years
In terms of householder income under 25 years, the demographic groups most similar to Haitians are Hungarian ($50,247, a difference of 0.030%), Immigrants from Dominican Republic ($50,204, a difference of 0.050%), Hispanic or Latino ($50,279, a difference of 0.10%), Immigrants from Dominica ($50,301, a difference of 0.14%), and Fijian ($50,132, a difference of 0.20%). Similarly, the demographic groups most similar to Belgians are Immigrants from Venezuela ($50,109, a difference of 0.010%), Fijian ($50,132, a difference of 0.040%), Immigrants from Laos ($50,041, a difference of 0.14%), Immigrants from Dominican Republic ($50,204, a difference of 0.18%), and Venezuelan ($50,011, a difference of 0.20%).
| Demographics | Rating | Rank | Householder Income Under 25 years |
| Immigrants | Haiti | 1.2 /100 | #253 | Tragic $50,398 |
| Luxembourgers | 1.2 /100 | #254 | Tragic $50,379 |
| Aleuts | 1.2 /100 | #255 | Tragic $50,377 |
| Immigrants | Cuba | 1.2 /100 | #256 | Tragic $50,374 |
| Lebanese | 1.1 /100 | #257 | Tragic $50,355 |
| Whites/Caucasians | 1.1 /100 | #258 | Tragic $50,336 |
| Immigrants | Dominica | 1.0 /100 | #259 | Tragic $50,301 |
| Hispanics or Latinos | 0.9 /100 | #260 | Tragic $50,279 |
| Hungarians | 0.9 /100 | #261 | Tragic $50,247 |
| Haitians | 0.8 /100 | #262 | Tragic $50,231 |
| Immigrants | Dominican Republic | 0.8 /100 | #263 | Tragic $50,204 |
| Fijians | 0.6 /100 | #264 | Tragic $50,132 |
| Belgians | 0.6 /100 | #265 | Tragic $50,113 |
| Immigrants | Venezuela | 0.6 /100 | #266 | Tragic $50,109 |
| Immigrants | Laos | 0.5 /100 | #267 | Tragic $50,041 |
| Venezuelans | 0.5 /100 | #268 | Tragic $50,011 |
| Ute | 0.5 /100 | #269 | Tragic $49,997 |
| Mexicans | 0.5 /100 | #270 | Tragic $49,989 |
| Taiwanese | 0.3 /100 | #271 | Tragic $49,804 |
| Colville | 0.3 /100 | #272 | Tragic $49,774 |
| Slovaks | 0.3 /100 | #273 | Tragic $49,753 |