Native Hawaiian vs Lithuanian Vision Disability
COMPARE
Native Hawaiian
Lithuanian
Vision Disability
Vision Disability Comparison
Native Hawaiians
Lithuanians
2.2%
VISION DISABILITY
33.3/ 100
METRIC RATING
186th/ 347
METRIC RANK
2.0%
VISION DISABILITY
97.7/ 100
METRIC RATING
80th/ 347
METRIC RANK
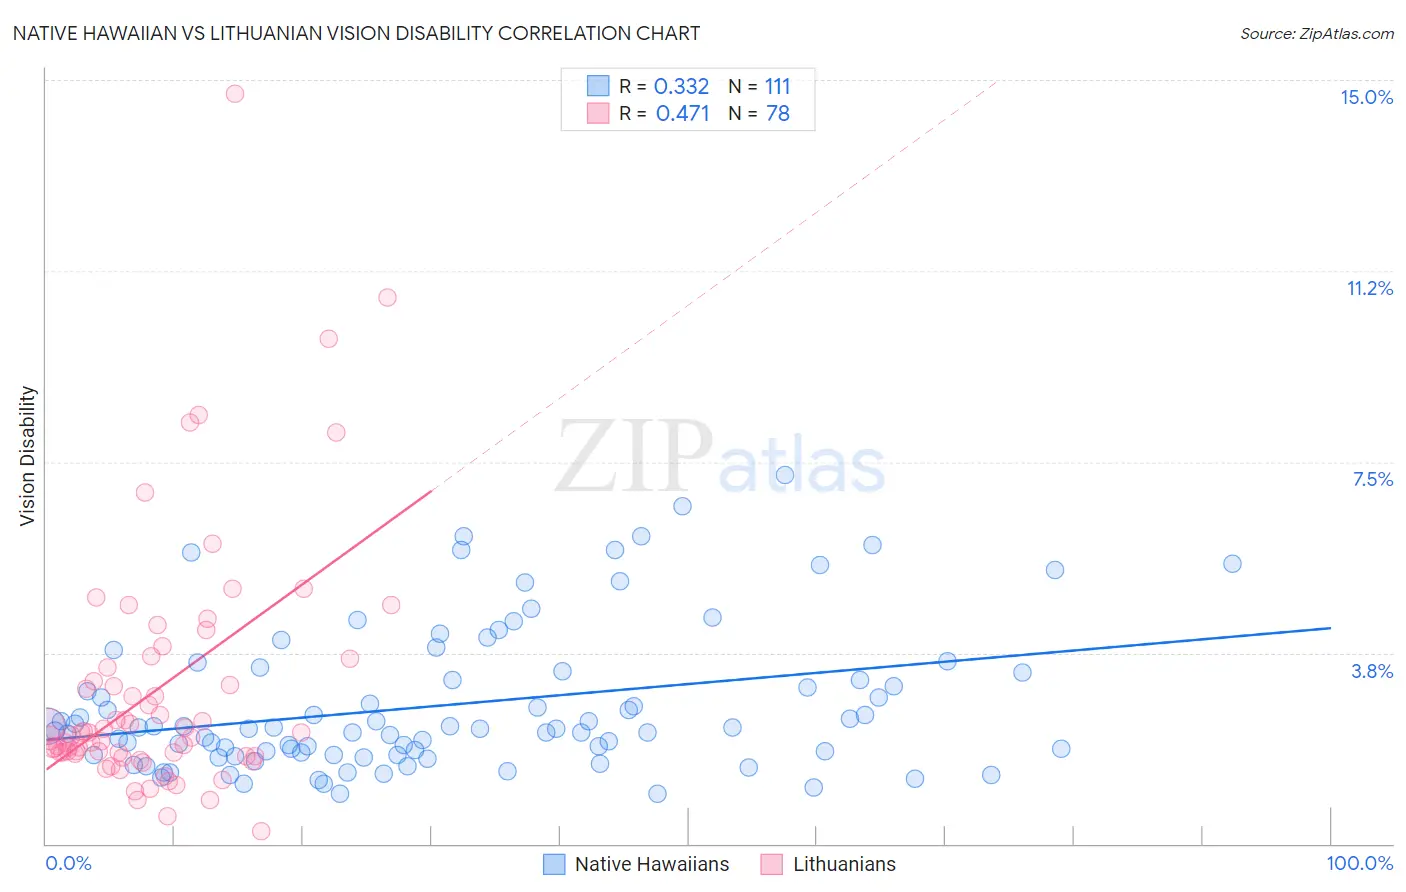
Native Hawaiian vs Lithuanian Vision Disability Correlation Chart
The statistical analysis conducted on geographies consisting of 331,807,196 people shows a mild positive correlation between the proportion of Native Hawaiians and percentage of population with vision disability in the United States with a correlation coefficient (R) of 0.332 and weighted average of 2.2%. Similarly, the statistical analysis conducted on geographies consisting of 421,489,399 people shows a moderate positive correlation between the proportion of Lithuanians and percentage of population with vision disability in the United States with a correlation coefficient (R) of 0.471 and weighted average of 2.0%, a difference of 7.4%.
Vision Disability Correlation Summary
| Measurement | Native Hawaiian | Lithuanian |
| Minimum | 0.98% | 0.23% |
| Maximum | 7.3% | 14.7% |
| Range | 6.3% | 14.5% |
| Mean | 2.7% | 3.0% |
| Median | 2.3% | 2.2% |
| Interquartile 25% (IQ1) | 1.7% | 1.8% |
| Interquartile 75% (IQ3) | 3.4% | 3.5% |
| Interquartile Range (IQR) | 1.6% | 1.7% |
| Standard Deviation (Sample) | 1.4% | 2.5% |
| Standard Deviation (Population) | 1.4% | 2.4% |
Similar Demographics by Vision Disability
Demographics Similar to Native Hawaiians by Vision Disability
In terms of vision disability, the demographic groups most similar to Native Hawaiians are Immigrants from Middle Africa (2.2%, a difference of 0.020%), Moroccan (2.2%, a difference of 0.14%), Immigrants from St. Vincent and the Grenadines (2.2%, a difference of 0.22%), Immigrants from Burma/Myanmar (2.2%, a difference of 0.31%), and Guyanese (2.2%, a difference of 0.32%).
| Demographics | Rating | Rank | Vision Disability |
| Immigrants | North America | 44.5 /100 | #179 | Average 2.2% |
| Uruguayans | 42.7 /100 | #180 | Average 2.2% |
| Immigrants | Western Europe | 41.1 /100 | #181 | Average 2.2% |
| Costa Ricans | 40.7 /100 | #182 | Average 2.2% |
| Immigrants | Burma/Myanmar | 37.9 /100 | #183 | Fair 2.2% |
| Moroccans | 35.4 /100 | #184 | Fair 2.2% |
| Immigrants | Middle Africa | 33.5 /100 | #185 | Fair 2.2% |
| Native Hawaiians | 33.3 /100 | #186 | Fair 2.2% |
| Immigrants | St. Vincent and the Grenadines | 30.3 /100 | #187 | Fair 2.2% |
| Guyanese | 28.9 /100 | #188 | Fair 2.2% |
| Salvadorans | 27.4 /100 | #189 | Fair 2.2% |
| Immigrants | Costa Rica | 26.1 /100 | #190 | Fair 2.2% |
| Canadians | 25.8 /100 | #191 | Fair 2.2% |
| Europeans | 25.7 /100 | #192 | Fair 2.2% |
| British | 25.1 /100 | #193 | Fair 2.2% |
Demographics Similar to Lithuanians by Vision Disability
In terms of vision disability, the demographic groups most similar to Lithuanians are Soviet Union (2.0%, a difference of 0.060%), Immigrants from Poland (2.0%, a difference of 0.090%), Immigrants from Western Asia (2.0%, a difference of 0.17%), Assyrian/Chaldean/Syriac (2.0%, a difference of 0.29%), and Immigrants from Latvia (2.0%, a difference of 0.29%).
| Demographics | Rating | Rank | Vision Disability |
| Immigrants | Eritrea | 98.4 /100 | #73 | Exceptional 2.0% |
| Palestinians | 98.3 /100 | #74 | Exceptional 2.0% |
| Immigrants | North Macedonia | 98.3 /100 | #75 | Exceptional 2.0% |
| Paraguayans | 98.3 /100 | #76 | Exceptional 2.0% |
| Immigrants | Jordan | 98.3 /100 | #77 | Exceptional 2.0% |
| Immigrants | Eastern Europe | 98.3 /100 | #78 | Exceptional 2.0% |
| Assyrians/Chaldeans/Syriacs | 98.1 /100 | #79 | Exceptional 2.0% |
| Lithuanians | 97.7 /100 | #80 | Exceptional 2.0% |
| Soviet Union | 97.6 /100 | #81 | Exceptional 2.0% |
| Immigrants | Poland | 97.6 /100 | #82 | Exceptional 2.0% |
| Immigrants | Western Asia | 97.5 /100 | #83 | Exceptional 2.0% |
| Immigrants | Latvia | 97.3 /100 | #84 | Exceptional 2.0% |
| Chinese | 97.2 /100 | #85 | Exceptional 2.0% |
| Immigrants | Moldova | 97.2 /100 | #86 | Exceptional 2.0% |
| Immigrants | Switzerland | 97.0 /100 | #87 | Exceptional 2.0% |