Hawaiian vs Lithuanian Median Earnings
COMPARE
Hawaiian
Lithuanian
Median Earnings
Median Earnings Comparison
Hawaiians
Lithuanians
$43,673
MEDIAN EARNINGS
2.0/ 100
METRIC RATING
252nd/ 347
METRIC RANK
$50,991
MEDIAN EARNINGS
99.8/ 100
METRIC RATING
70th/ 347
METRIC RANK
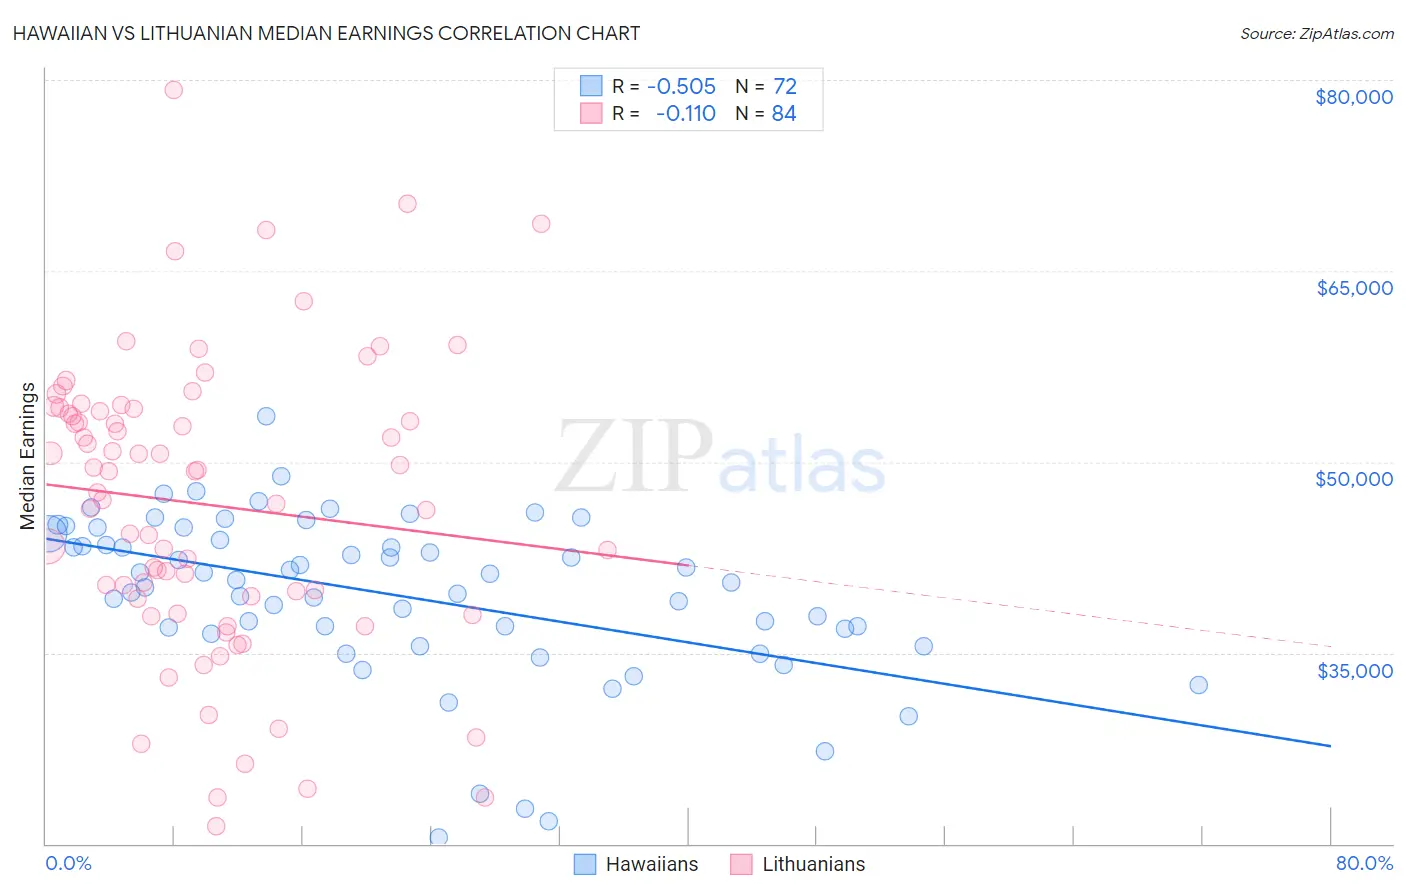
Hawaiian vs Lithuanian Median Earnings Correlation Chart
The statistical analysis conducted on geographies consisting of 327,597,222 people shows a substantial negative correlation between the proportion of Hawaiians and median earnings in the United States with a correlation coefficient (R) of -0.505 and weighted average of $43,673. Similarly, the statistical analysis conducted on geographies consisting of 421,906,288 people shows a poor negative correlation between the proportion of Lithuanians and median earnings in the United States with a correlation coefficient (R) of -0.110 and weighted average of $50,991, a difference of 16.8%.
Median Earnings Correlation Summary
| Measurement | Hawaiian | Lithuanian |
| Minimum | $20,530 | $21,331 |
| Maximum | $53,613 | $79,217 |
| Range | $33,083 | $57,886 |
| Mean | $39,525 | $46,654 |
| Median | $40,637 | $48,402 |
| Interquartile 25% (IQ1) | $36,694 | $39,359 |
| Interquartile 75% (IQ3) | $44,126 | $54,080 |
| Interquartile Range (IQR) | $7,432 | $14,721 |
| Standard Deviation (Sample) | $6,473 | $11,467 |
| Standard Deviation (Population) | $6,428 | $11,398 |
Similar Demographics by Median Earnings
Demographics Similar to Hawaiians by Median Earnings
In terms of median earnings, the demographic groups most similar to Hawaiians are Tsimshian ($43,695, a difference of 0.050%), Alaska Native ($43,750, a difference of 0.18%), Somali ($43,567, a difference of 0.24%), Liberian ($43,536, a difference of 0.31%), and Malaysian ($43,844, a difference of 0.39%).
| Demographics | Rating | Rank | Median Earnings |
| Immigrants | Burma/Myanmar | 3.2 /100 | #245 | Tragic $43,998 |
| Immigrants | West Indies | 3.1 /100 | #246 | Tragic $43,989 |
| Immigrants | Cabo Verde | 3.0 /100 | #247 | Tragic $43,963 |
| Nepalese | 2.6 /100 | #248 | Tragic $43,860 |
| Malaysians | 2.6 /100 | #249 | Tragic $43,844 |
| Alaska Natives | 2.3 /100 | #250 | Tragic $43,750 |
| Tsimshian | 2.1 /100 | #251 | Tragic $43,695 |
| Hawaiians | 2.0 /100 | #252 | Tragic $43,673 |
| Somalis | 1.8 /100 | #253 | Tragic $43,567 |
| Liberians | 1.7 /100 | #254 | Tragic $43,536 |
| Immigrants | Middle Africa | 1.4 /100 | #255 | Tragic $43,416 |
| Alaskan Athabascans | 1.4 /100 | #256 | Tragic $43,393 |
| Jamaicans | 1.3 /100 | #257 | Tragic $43,343 |
| French American Indians | 1.3 /100 | #258 | Tragic $43,333 |
| German Russians | 1.1 /100 | #259 | Tragic $43,200 |
Demographics Similar to Lithuanians by Median Earnings
In terms of median earnings, the demographic groups most similar to Lithuanians are Immigrants from Ukraine ($50,984, a difference of 0.010%), Mongolian ($51,038, a difference of 0.090%), Paraguayan ($51,068, a difference of 0.15%), Immigrants from Egypt ($50,901, a difference of 0.18%), and Immigrants from Spain ($51,092, a difference of 0.20%).
| Demographics | Rating | Rank | Median Earnings |
| Immigrants | Bulgaria | 99.9 /100 | #63 | Exceptional $51,318 |
| New Zealanders | 99.9 /100 | #64 | Exceptional $51,246 |
| Greeks | 99.9 /100 | #65 | Exceptional $51,164 |
| Afghans | 99.9 /100 | #66 | Exceptional $51,112 |
| Immigrants | Spain | 99.9 /100 | #67 | Exceptional $51,092 |
| Paraguayans | 99.9 /100 | #68 | Exceptional $51,068 |
| Mongolians | 99.8 /100 | #69 | Exceptional $51,038 |
| Lithuanians | 99.8 /100 | #70 | Exceptional $50,991 |
| Immigrants | Ukraine | 99.8 /100 | #71 | Exceptional $50,984 |
| Immigrants | Egypt | 99.8 /100 | #72 | Exceptional $50,901 |
| Immigrants | Netherlands | 99.8 /100 | #73 | Exceptional $50,818 |
| South Africans | 99.8 /100 | #74 | Exceptional $50,752 |
| Immigrants | Scotland | 99.8 /100 | #75 | Exceptional $50,741 |
| Immigrants | Italy | 99.7 /100 | #76 | Exceptional $50,581 |
| Immigrants | Western Europe | 99.7 /100 | #77 | Exceptional $50,549 |