Mongolian vs Armenian Median Female Earnings
COMPARE
Mongolian
Armenian
Median Female Earnings
Median Female Earnings Comparison
Mongolians
Armenians
$42,542
MEDIAN FEMALE EARNINGS
99.7/ 100
METRIC RATING
73rd/ 347
METRIC RANK
$42,212
MEDIAN FEMALE EARNINGS
99.5/ 100
METRIC RATING
84th/ 347
METRIC RANK
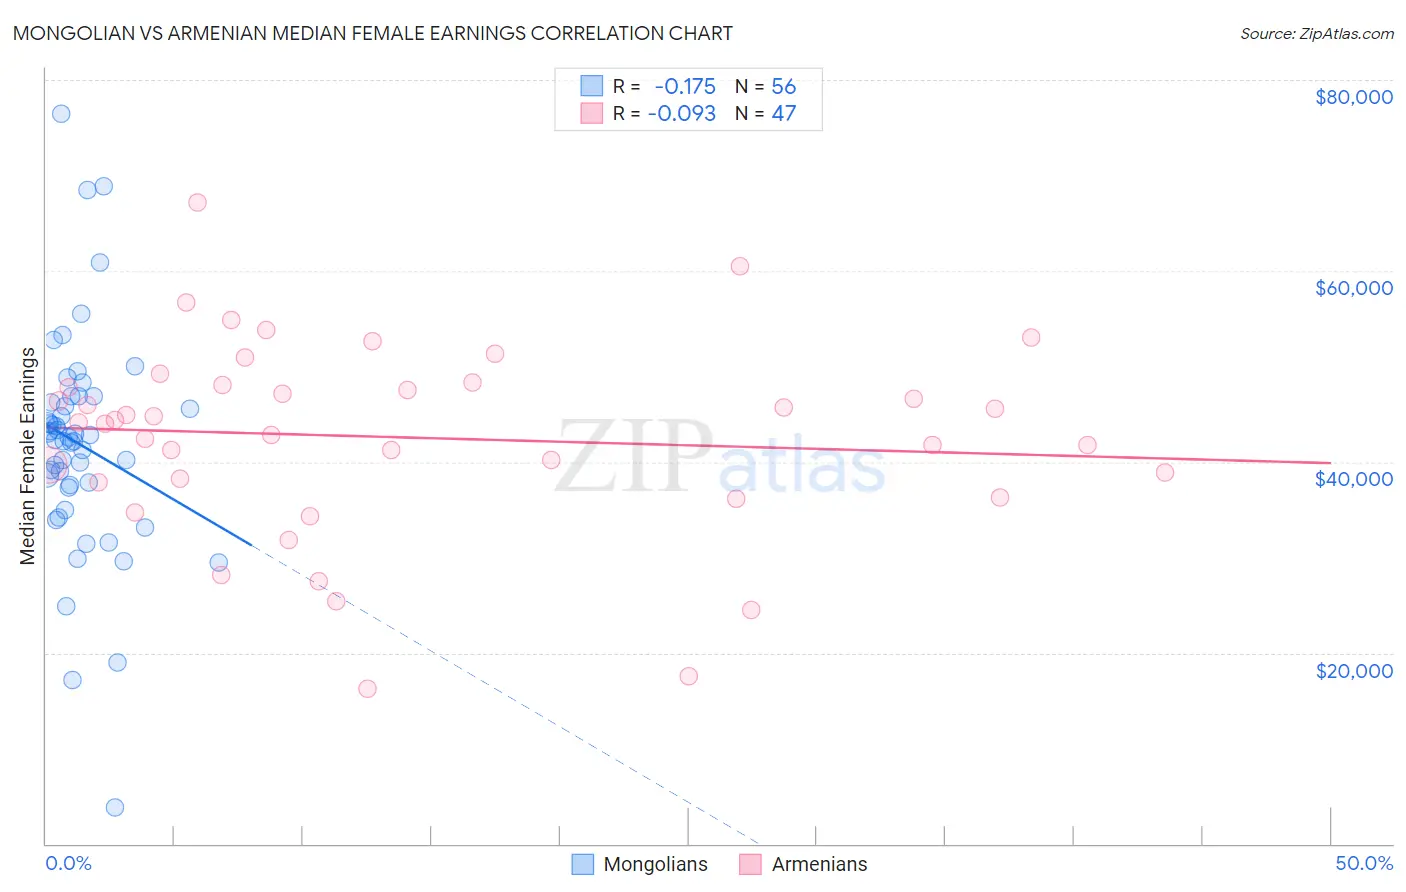
Mongolian vs Armenian Median Female Earnings Correlation Chart
The statistical analysis conducted on geographies consisting of 140,350,842 people shows a poor negative correlation between the proportion of Mongolians and median female earnings in the United States with a correlation coefficient (R) of -0.175 and weighted average of $42,542. Similarly, the statistical analysis conducted on geographies consisting of 310,826,336 people shows a slight negative correlation between the proportion of Armenians and median female earnings in the United States with a correlation coefficient (R) of -0.093 and weighted average of $42,212, a difference of 0.78%.
Median Female Earnings Correlation Summary
| Measurement | Mongolian | Armenian |
| Minimum | $3,764 | $16,250 |
| Maximum | $76,486 | $67,117 |
| Range | $72,722 | $50,867 |
| Mean | $41,823 | $42,561 |
| Median | $42,408 | $44,186 |
| Interquartile 25% (IQ1) | $37,469 | $37,899 |
| Interquartile 75% (IQ3) | $46,493 | $48,091 |
| Interquartile Range (IQR) | $9,024 | $10,192 |
| Standard Deviation (Sample) | $11,821 | $10,212 |
| Standard Deviation (Population) | $11,715 | $10,102 |
Demographics Similar to Mongolians and Armenians by Median Female Earnings
In terms of median female earnings, the demographic groups most similar to Mongolians are Immigrants from South Africa ($42,508, a difference of 0.080%), Albanian ($42,584, a difference of 0.10%), New Zealander ($42,446, a difference of 0.23%), Immigrants from Italy ($42,446, a difference of 0.23%), and Immigrants from Albania ($42,388, a difference of 0.36%). Similarly, the demographic groups most similar to Armenians are Immigrants from Sierra Leone ($42,214, a difference of 0.010%), Immigrants from Morocco ($42,229, a difference of 0.040%), Immigrants from Southern Europe ($42,275, a difference of 0.15%), Laotian ($42,133, a difference of 0.19%), and Immigrants from Moldova ($42,304, a difference of 0.22%).
| Demographics | Rating | Rank | Median Female Earnings |
| Immigrants | Austria | 99.8 /100 | #68 | Exceptional $42,824 |
| Immigrants | Spain | 99.8 /100 | #69 | Exceptional $42,815 |
| Immigrants | Ethiopia | 99.8 /100 | #70 | Exceptional $42,744 |
| Immigrants | Romania | 99.8 /100 | #71 | Exceptional $42,718 |
| Albanians | 99.8 /100 | #72 | Exceptional $42,584 |
| Mongolians | 99.7 /100 | #73 | Exceptional $42,542 |
| Immigrants | South Africa | 99.7 /100 | #74 | Exceptional $42,508 |
| New Zealanders | 99.7 /100 | #75 | Exceptional $42,446 |
| Immigrants | Italy | 99.7 /100 | #76 | Exceptional $42,446 |
| Immigrants | Albania | 99.6 /100 | #77 | Exceptional $42,388 |
| Immigrants | Kazakhstan | 99.6 /100 | #78 | Exceptional $42,386 |
| Greeks | 99.6 /100 | #79 | Exceptional $42,336 |
| Immigrants | Moldova | 99.6 /100 | #80 | Exceptional $42,304 |
| Immigrants | Southern Europe | 99.5 /100 | #81 | Exceptional $42,275 |
| Immigrants | Morocco | 99.5 /100 | #82 | Exceptional $42,229 |
| Immigrants | Sierra Leone | 99.5 /100 | #83 | Exceptional $42,214 |
| Armenians | 99.5 /100 | #84 | Exceptional $42,212 |
| Laotians | 99.4 /100 | #85 | Exceptional $42,133 |
| Immigrants | St. Vincent and the Grenadines | 99.3 /100 | #86 | Exceptional $42,108 |
| Lithuanians | 99.3 /100 | #87 | Exceptional $42,108 |
| Immigrants | Northern Africa | 99.3 /100 | #88 | Exceptional $42,084 |